TL;DR
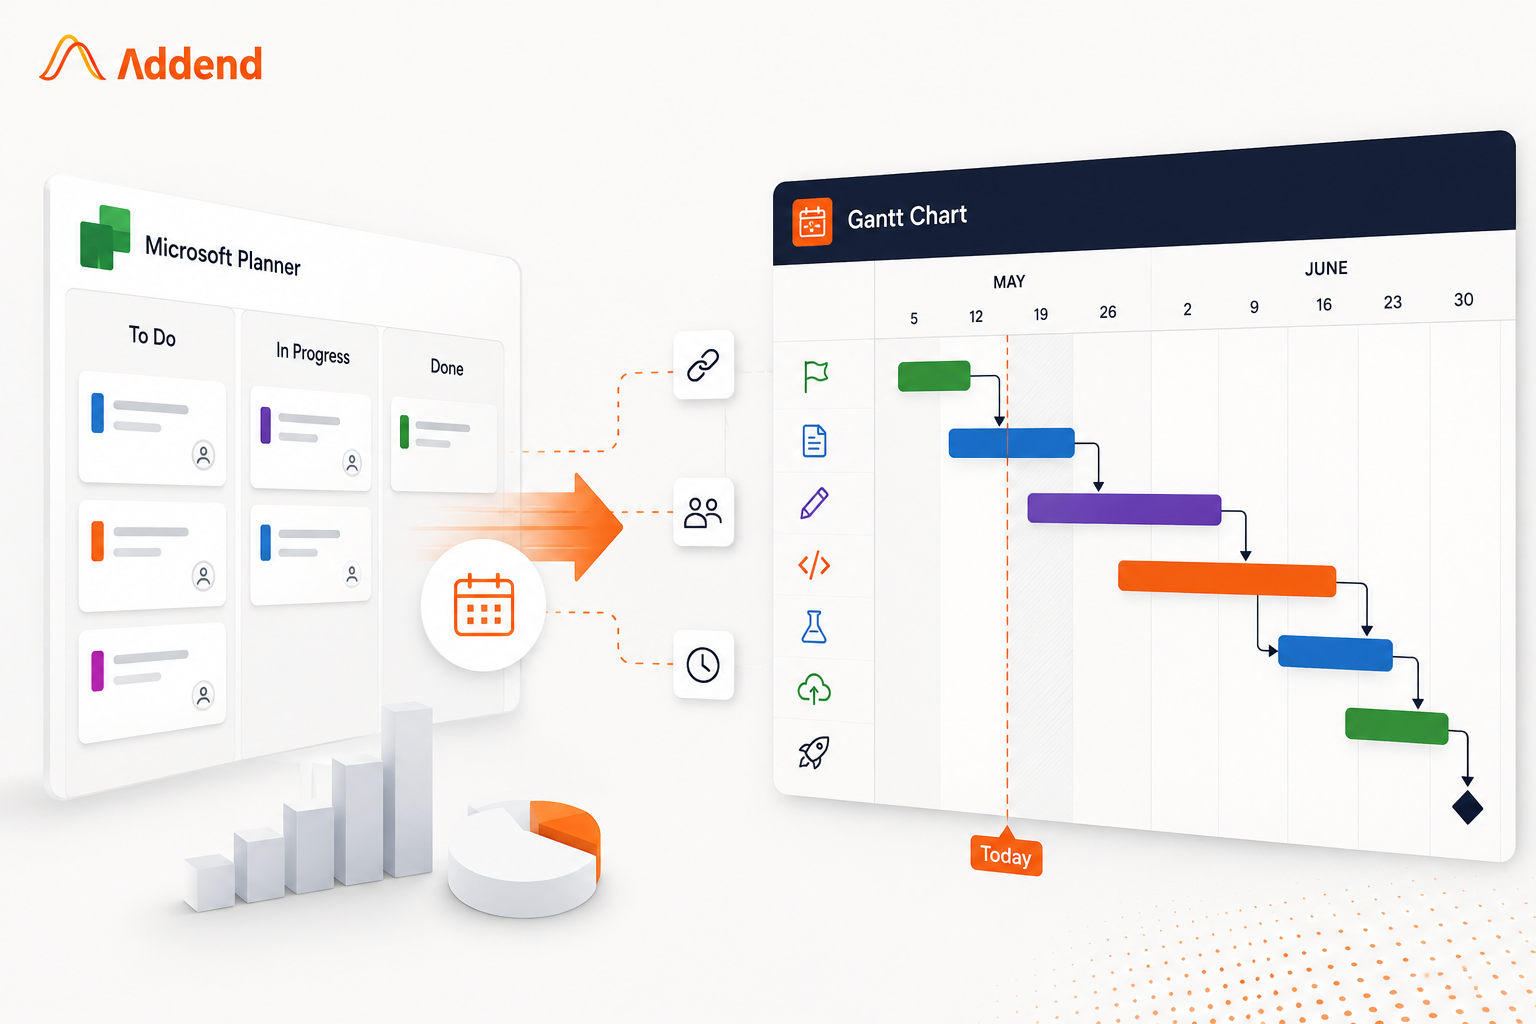
Microsoft Planner lacks a built-in Gantt chart or timeline view. A Gantt chart shows tasks as bars on a timeline. It reveals delays, task dependencies, and resourcing conflicts clearly. This visibility becomes critical as projects grow more complex. Planner’s simplicity makes it easy to use, but visibility suffers. Common workarounds like Excel exports or PowerPoint charts do not scale. A proper Gantt view helps teams stay on schedule.
Microsoft Planner is great for tracking who does what. Boards and buckets keep tasks organized and simple. But Planner cannot show you a real timeline. It cannot show when one delay affects other tasks. There is no Microsoft Planner Gantt chart built in. There are no timeline bars or visible dependencies.
This creates real problems for busy team leads. Meetings run long, and handoffs get missed often. Nobody feels sure the project stays on track. The good news is this problem is fixable. You do not need to abandon Planner at all.
What Is a Gantt Chart, Exactly?
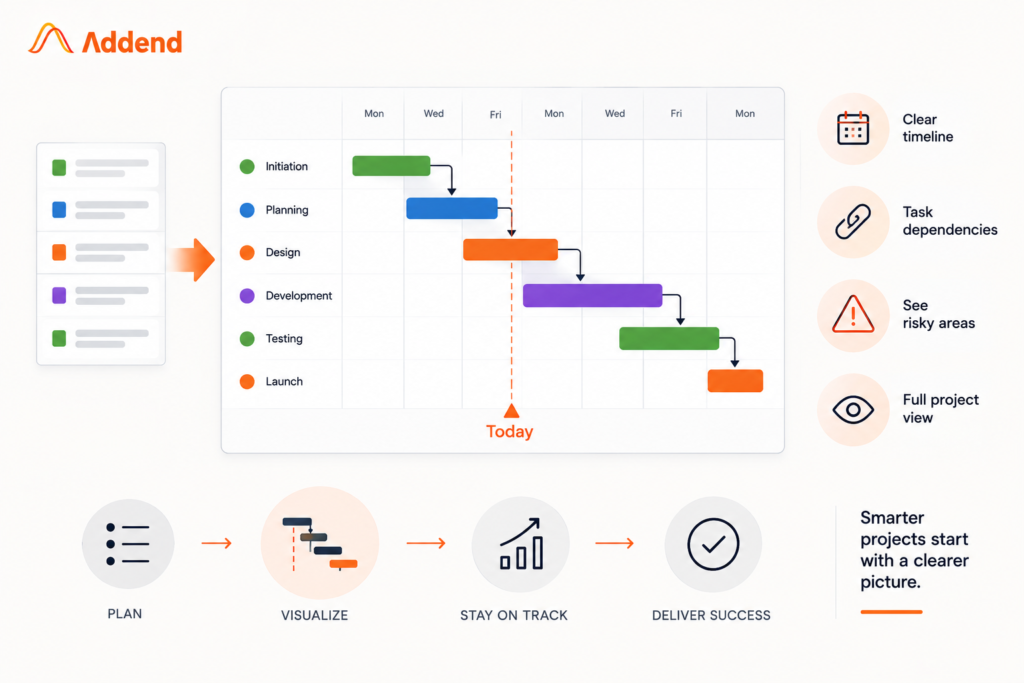
A Gantt chart is a simple project timeline tool. It shows each task as a horizontal bar. The bar length shows how long the task takes. Bars are placed along a calendar style timeline. This makes start dates and end dates visible instantly.
Gantt charts also show task dependencies between team members. A dependency means one task must finish first. For example, design must finish before development starts. This concept was named after Henry Gantt himself. He created this chart style in the early 1900s.
Today, Gantt charts remain a standard planning tool. Project managers use them across nearly every industry. They turn a task list into a clear picture.
Why a Gantt Chart Matters for Your Team
A Gantt chart answers questions a task board cannot. It shows exactly where a project is falling behind. It shows which delays actually matter for the deadline. It shows which team members face overload next month.
A timeline view also makes reporting much easier. Showing a timeline tells the project story instantly. Scrolling through a task board takes much longer.
Why Doesn’t Planner Have This Built In?
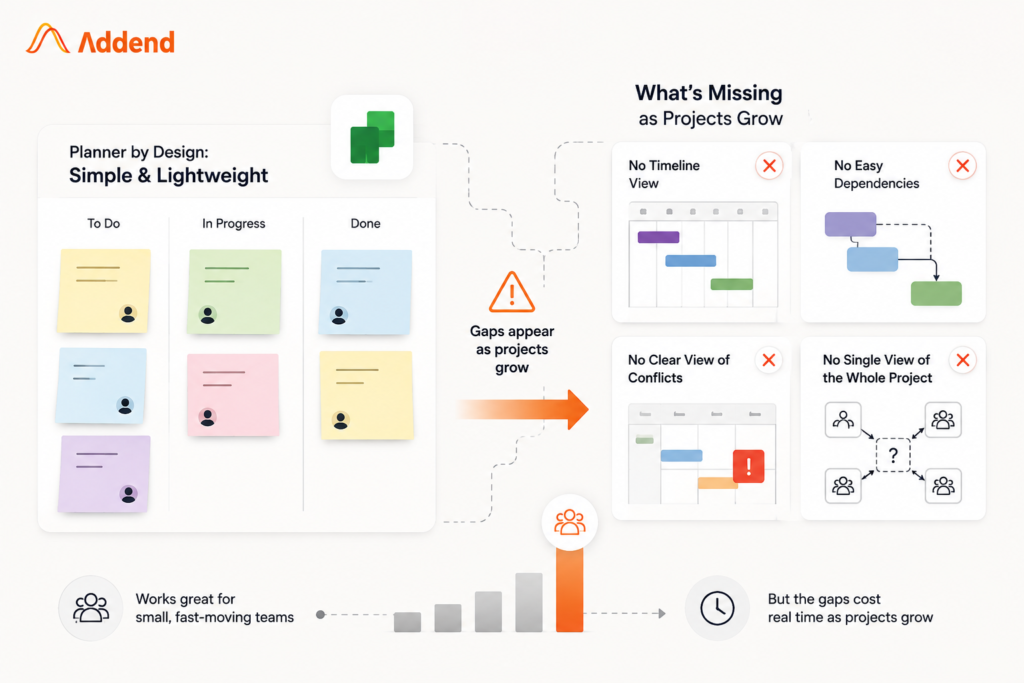
Planner was built to stay simple and lightweight. Think of it as sticky notes on a wall. You create a task and assign it quickly. You set a due date and move it along. This works well for small, fast moving teams. But that simplicity comes with a real cost. Planner skips features that bigger projects truly need.
- There is no Microsoft Planner timeline view for dates.
- There is no way to set task dependencies easily.
- There is no way to see scheduling conflicts clearly.
- There is no single view of the whole project.
Once a project grows, these gaps cost real time.
The Common Workarounds, and Why They Fall Short
Most teams try a few workarounds before finding a fix.
Some export Planner tasks into Excel by hand. This works once, but breaks the moment plans change.
Some switch entirely to Project for the Web. That means giving up the simple Planner boards. It also means managing two separate tools daily.
Some build a Gantt chart manually in PowerPoint. It looks accurate for a day, then goes stale.
None of these approaches scale well over time. Teams need a simpler way to see their timeline.
The Fix: Add a Gantt Chart to Microsoft Planner
The app connects directly to your existing Planner plans. It turns those plans into a live Gantt chart. You get task bars, dates, and dependencies instantly. This gives you a full Microsoft Planner project timeline instantly.
Your team keeps working in Planner as before. Nothing changes in their daily task management routine. The timeline view simply sits on top instantly. It pulls from the same data in real time. There is no double entry and no new habits.
You can download the app and connect it today.
How Addend Analytics Solves This For You
Addend Analytics specializes in turning raw business data into clear insights. The Planner Gantt Chart app grew directly from that expertise. Addend understands how teams struggle without proper timeline visibility. That is why the app connects instantly to existing Planner plans. There is no migration, no manual re-entry, and no new software.
Addend also supports teams beyond just the app itself. Our consultants help set up dependencies and configure views correctly. We tailor the timeline to match your specific workflow. Addend also connects Planner data to Power BI dashboards. This gives leadership a broader view of project performance.
Support does not stop once installation is complete. Addend stays available to help teams get full value. If you need deeper Microsoft 365 support, we help there too. Our team handles custom dashboards, automation, and reporting needs.
What to Look For in a Planner Gantt Chart Extension
The best Gantt chart for Microsoft Planner follows a few rules.
- It should read directly from your existing Planner plans.
- It should never require a separate task list.
- It should map real dependencies, not just due dates.
- It should fit inside your Microsoft 365 environment fully.
- That means no new login and no new review.
- It should never disrupt how your team already works.
Getting Started
Getting started does not require a big rollout plan. The app connects to plans your team already uses. Most people see their first timeline within minutes.
First, pick one active plan with dependent tasks. Next, install the app from Microsoft AppSource directly. Then connect that app to your chosen plan. Finally, bring up the timeline at your next meeting. Skip the usual slow walkthrough of the task board.
Adding more plans afterward takes almost no effort.
Addend also offers broader Microsoft Power Platform consulting services. These connect Planner, Power BI, and Power Automate together. Together, they give you one clear performance view.
The Bottom Line
Microsoft Planner was never built to show timelines. That is fine, since Planner has a different purpose. But growing teams need more visibility than boards offer. You should not have to give up Planner’s simplicity. Adding a Gantt chart gives you both strengths together. You keep the lightweight board your team already knows. You gain the timeline view leadership actually needs.
Key Takeaways
- Microsoft Planner has no built-in Gantt chart or timeline view.
- A Gantt chart shows task timelines and dependencies clearly.
- Planner stays simple by design, so it skips timelines.
- Common workarounds like Excel or PowerPoint do not scale.
- Addend Analytics built a Gantt Chart app for Planner.
- The app adds real-time timelines without changing your workflow.
Frequently Asked Questions
Common questions about Gantt charts, timelines, and dependencies in Microsoft Planner.
Author By

Gaurav Lakhotia
Gaurav holds an MBA in Business Analytics. As a data geek and avid learner, he has earned accolades including Microsoft Certified Data Analyst, Microsoft Certified Azure Administrator, and active Power BI Community contributor. He is also a Microsoft Certified Trainer. With critical thinking and project delivery skills, he strives to achieve customer delight in Data Analytics projects. Gaurav loves travelling with friends when he is not busy working on data.