
Introduction
Power BI is a powerful business intelligence tool that enables users to visualize and analyse data from various sources. One of the key features that make Power BI versatile is its ability to handle different data types, including text data. When dealing with text data, it’s essential to understand how to manipulate and transform it effectively. In this blog post, we will explore the Unicode() function in Power BI, a valuable tool for working with text data.
Understanding Unicode
Unicode is a standard character encoding system that assigns a unique number, called a code point, to each character in nearly every script and language in the world. It ensures that text in any language can be encoded and displayed consistently across different platforms and systems. In Power BI, the Unicode() function is used to return the Unicode code point of a specified character.
Syntax of the Unicode() Function:
Unicode(text as text) as number
– `text`: This is the input text from which you want to retrieve the Unicode code point. It can be a single character or a longer text string.
How to Use the Unicode() Function
Let’s dive into some practical examples of how to use the Unicode() function in Power BI:
Example : Finding the Unicode Code Point of a Single Character
Suppose you have a single character, such as ‘A’, and you want to find its Unicode code point. You can use the Unicode() function as follows:
Unicode(“A”)
The function will return the Unicode code point for ‘A’, which is 65.
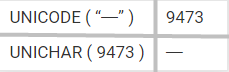
Example 2: Unicode for “—”
Conclusion
Unicode() in Power BI is great for text data. It helps with character analysis and finding Unicode code points. Use it for single characters or text strings. It boosts text data transformation and improves your Power BI reports.
Author By

Rajeshwari Sharma
Rajeshwari is an experienced data professional with a track record of using data-driven insights to improve business performance. She has successfully managed multiple projects, utilising her expertise in data analysis and database administration. As a Microsoft-certified Data Analyst and Azure Database Administrator, she has cultivated a deep understanding of data management best practices and advanced analytics techniques. Her MBA in Business Analytics has equipped her with a solid foundation for integrating business strategy with data insights.