TL;DR
Your OEE number is probably wrong, and it’s not your fault. It comes from spreadsheets, MES exports, and a bit of manual math nobody fully trusts. This post shows the actual data architecture behind a real-time Power BI OEE dashboard, how to choose between building, buying, or partnering, and the honest benchmark for your industry instead of a flat 85% target.
Most operations teams already know their OEE number. They just don’t trust it. It comes from three different spreadsheets, a shift-end MES export, and a bit of manual math that everyone quietly adjusts.
That’s the real complication. It’s not that OEE is hard to define. Getting it live, accurate, and in one place is the hard part. That means pulling from ERP, MES, and shop floor systems into one view. It’s a data problem, not a metrics problem.. Most teams searching for “power bi manufacturing” already know Power BI can build a dashboard. What they’re stuck on is what has to happen before the dashboard, and which approach fits their plant and their legacy systems.
This post gives you a working framework for the data layer behind a real-time OEE dashboard. Its a way to evaluate build vs. buy vs. partner, and a benchmark that you can actually use.
A live OEE dashboard isn’t a Power BI project. It’s a data plumbing project with a dashboard at the end of it.
Why Real-Time OEE Is Harder Than Most Manufacturing Analytics Guides Suggest
Most vendor content shows a finished dashboard. Gauges, KPI cards, a trend line. It looks simple.
What it skips is the six months before that dashboard existed. Someone had to pull data out of a PLC, an MES, a paper log, or all three. Someone had to agree on what counts as “planned downtime” versus “unplanned downtime.” Someone had to decide how often the number refreshes.
None of that is a Power BI problem. Power BI is very good at displaying a number once that number exists in a clean, structured form. The hard part happens upstream of the dashboard, in systems most BI vendors never touch.
That single stat explains a lot of failed OEE initiatives. A plant spends months building a dashboard around a number that was already wrong. Power BI can absolutely fix this. But only if the data feeding it is accurate and current, not just visually polished.
What a Real-Time OEE Dashboard Actually Needs
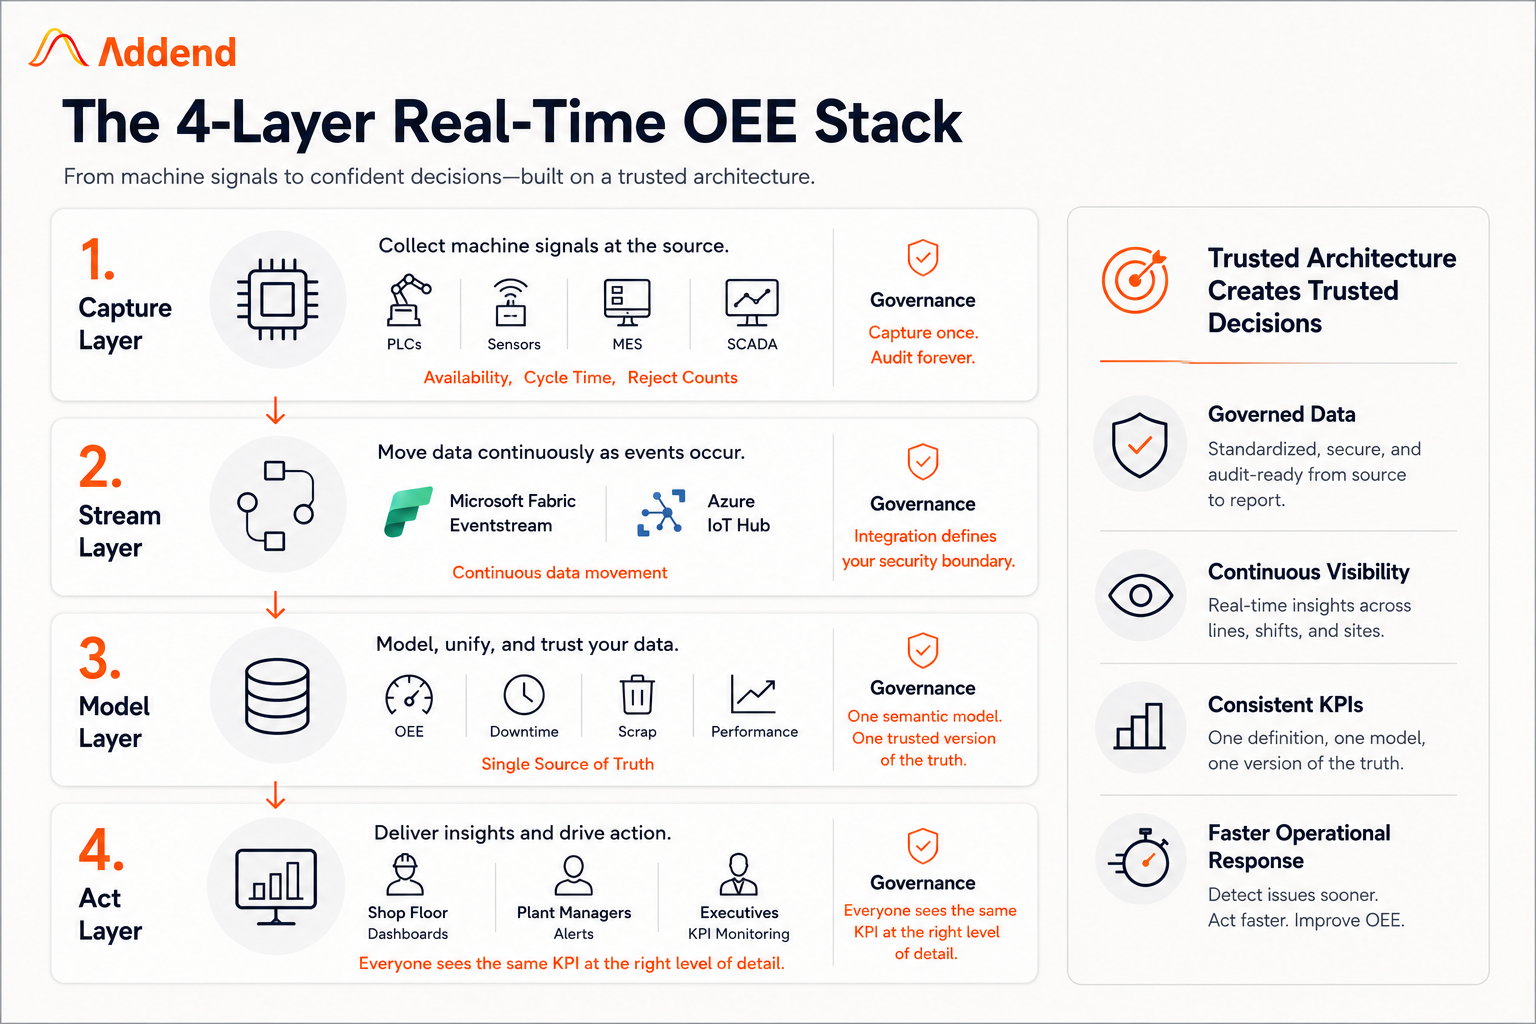
Here’s the part most guides skip: the plumbing. We call this the 4-Layer Real-Time OEE Stack. It’s the structure behind every OEE dashboard we’ve built that actually stayed accurate after go-live.
- Capture layer
PLCs, IoT sensors, MES, and SCADA systems collect raw signals at the machine. This is where availability, cycle time, and reject counts originate.
- Stream layer
Tools like Microsoft Fabric Eventstream or Azure IoT Hub move that data continuously as it happens, instead of batching it once per shift.
- Model layer
A semantic model in Power BI, built on a Fabric Lakehouse or Direct Lake, turns raw events into trusted OEE, downtime, and scrap metrics. This is where the “single source of truth” argument actually gets settled.
- Act layer
Dashboards for the shop floor, plant managers, and executives show the same underlying number at different levels of detail, with alerts when a threshold is crossed.
“End-to-end data can move from the plant floor into a live analytics workspace within 20 to 30 seconds using modern streaming architecture.” — Microsoft Fabric Blog, 2026
Build In-House vs. Buy OEE Software vs. Work With a Partner
Once the architecture makes sense, the real decision is who builds it. There are three realistic paths, and each fits a different plant.
| Factor | Build In-House | Buy OEE Software | Work With a Partner |
| Time to value | 6 to 12 months | 4 to 8 weeks | 8 to 12 weeks |
| Customization | High, if you have BI talent | Low, fixed templates | High, tailored to your systems |
| IT burden | Heavy, ongoing maintenance | Light | Moderate, shared with partner |
| Cost pattern | High upfront, drops over time | Subscription, scales per site | Project fee plus support |
| Best for | Large, well-staffed IT teams | Single-site, standard processes | Multi-plant, mixed legacy systems |
What this table means for you: if your plant runs mixed legacy equipment across more than one site, a partner-led Power BI build usually gets you live, trusted data faster than either extreme.
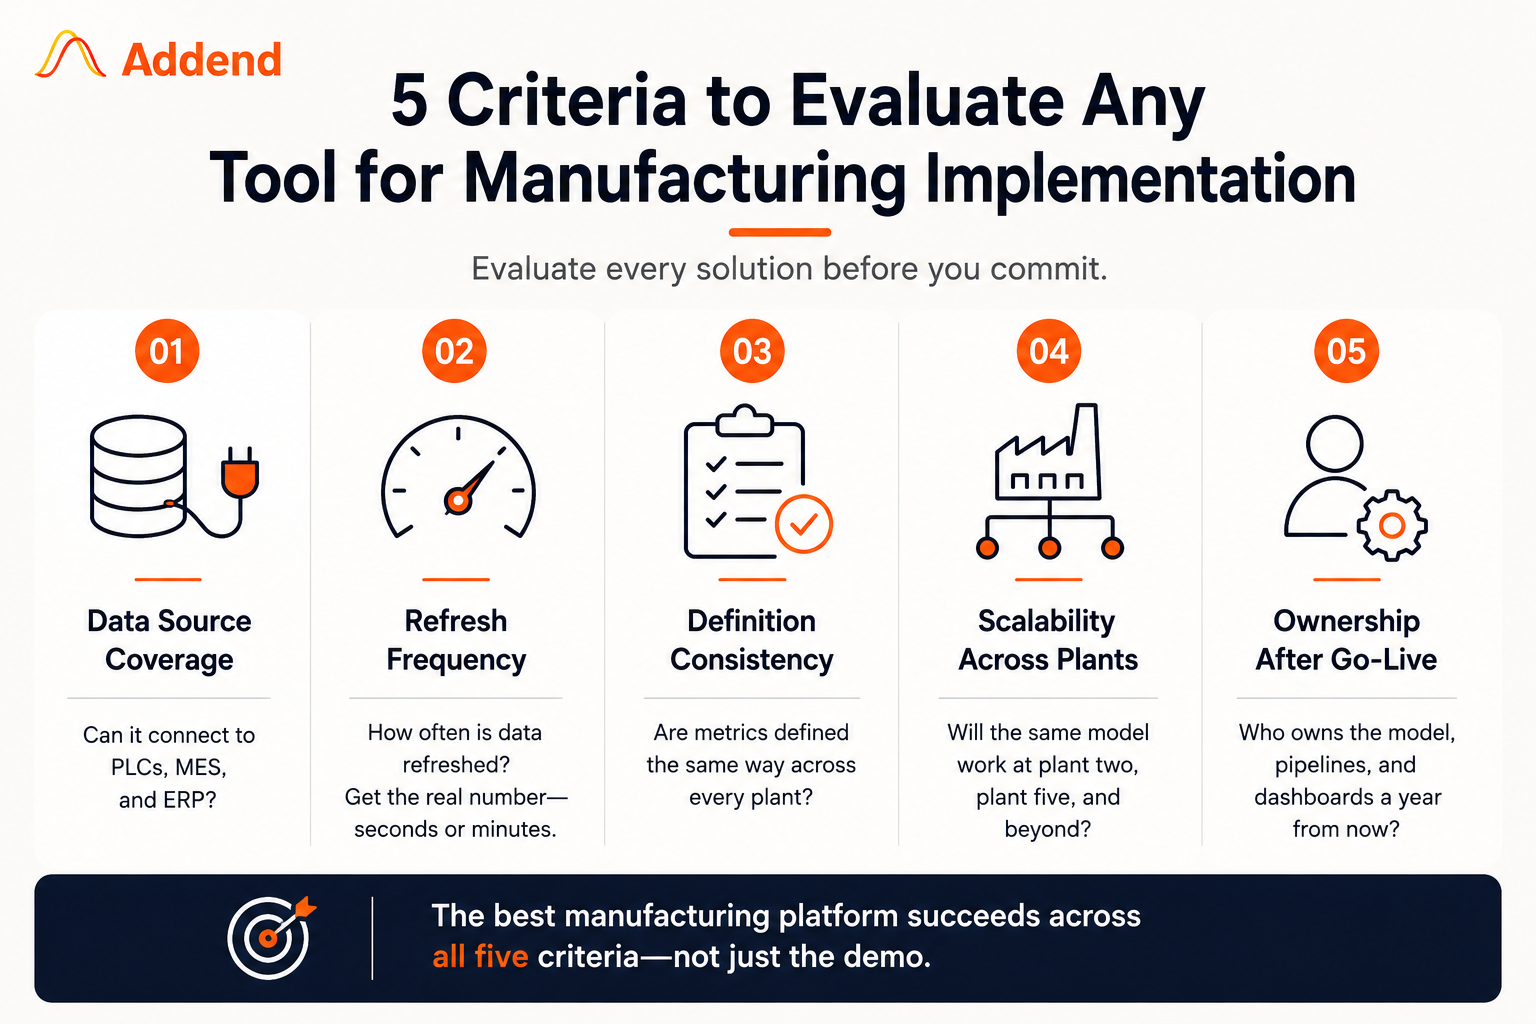
The 5 Criteria to Evaluate Any Tool for Manufacturing Implementation Approach
Whichever path you’re leaning toward, judge it against these five criteria before you commit.
- Data source coverage
Can it actually connect to your PLCs, MES, and ERP, or only to the systems the vendor prefers? Ask for a named list of the connectors it supports, not a general yes.
- Refresh frequency
Ask for the real number in seconds or minutes, not the word “real-time” on its own. A 15-minute refresh is not the same thing as a live shop floor feed.
- Definition consistency
Does every plant calculate availability, performance, and quality the same way? This is where ISO 22400 alignment matters, especially once you compare more than one site.
- Scalability across plants
Will this same model work at plant two and plant five, or does it get rebuilt each time? A model that only works for one site is a pilot, not a platform.
- Ownership after go-live
Who maintains the semantic model, the data pipelines, and the dashboards a year from now? This is the question most proposals leave out entirely.
Where Manufacturers Get OEE Tracking Wrong
Most of the mistakes we see aren’t about Power BI. They’re about the benchmark and the baseline.
“Discrete manufacturers average 66.8% OEE, with medical device plants reaching 78.2% and trailer and RV makers averaging just 57.2%.” — Godlan, 2025
Chasing a flat 85% “world-class” target across every plant and product line sets teams up to fail. The real question is how your plant compares to others in your specific industry and process type, not to a number from a different manufacturing world entirely.
“Only about 6% of manufacturers sustain an OEE score of 85% or higher.” — Evocon, 2024
The second common mistake is treating OEE as a single company-wide number instead of a shift-level, line-level signal. A dashboard that only shows a monthly average hides exactly the pattern you’re trying to catch.
The third mistake is measuring OEE manually and assuming the number is close enough. It rarely is. Once a plant moves to machine-connected tracking, the honest baseline is almost always lower than what the old spreadsheet reported, and that lower number is the real starting point for improvement.
Inside a Real Build: A Beauty Care Manufacturer’s OEE and Reporting Overhaul
Real Results from a Beauty Care Manufacturer
One integrated analytics platform replaced four disconnected systems, giving every department access to the same live operational data and a single source of truth.
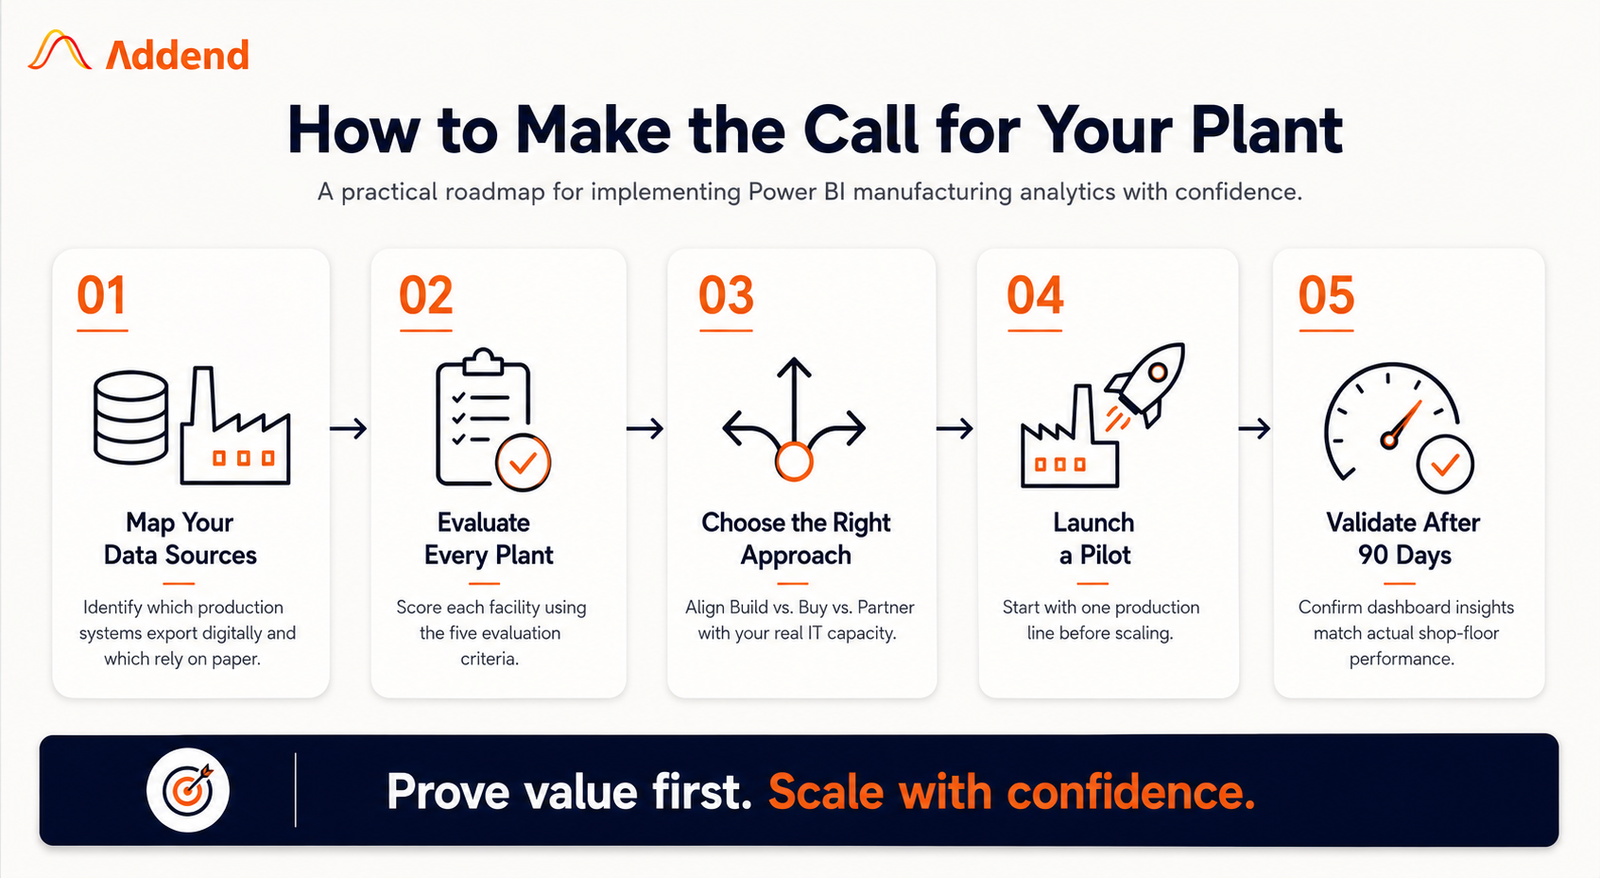
How to Make the Call for Your Plant
Use this short sequence to decide, rather than defaulting to whichever vendor called first.
- Map your current data sources and note which ones already export digitally versus on paper. This alone usually surfaces gaps nobody had documented before.
- Score your plant against the 5 criteria above, plant by plant if you run more than one site.
- Match your findings to the build vs. buy vs. partner table, and be honest about your actual IT bandwidth, not your ideal one.
- Pick one production line as a pilot before rolling out to every plant. A working pilot builds the internal case a slide deck never will.
- Set a 90-day checkpoint to confirm the number your dashboard shows matches what the floor actually experienced during that stretch.
What to Do in the Next 30 Days
You don’t need a 12-month roadmap to get started. Here’s a realistic first month.
- Week 1: List every system currently feeding your OEE number, including any spreadsheet still in the loop.
- Week 2: Pick one line or one plant as a pilot, not your whole operation.
- Week 3: Decide which of the three paths, build, buy, or partner, fits your team’s bandwidth and legacy system mix.
- Week 4: Run a small proof of concept connecting one real data source into a Power BI dashboard, even a rough one.
Key Takeaways
- A live OEE dashboard is a data architecture project, not a Power BI project. The dashboard is the easy part.
- Get the capture, stream, and model layers right first. Everything downstream depends on them.
- Start with one pilot line and one honest baseline before you scale to every plant.
- Benchmark against your industry, not a flat 85% target that most plants can’t defend.
Once the architecture and benchmark are right, the build-vs-buy-vs-partner call gets much easier to make.
Frequently Asked Questions
What is OEE in manufacturing?
OEE stands for Overall Equipment Effectiveness. It measures how much of your planned production time is actually productive, combining availability, performance, and quality into one score.
How do you calculate OEE in Power BI?
Power BI calculates OEE using three DAX measures. Availability divides actual run time by planned production time. Performance divides output by ideal cycle time. Quality divides good units by total units. Multiply all three together to get the OEE score.
What is a good OEE score?
It depends on your industry. Discrete manufacturing averages 66.8% OEE, medical device plants reach 78.2%, and trailer and RV makers average 57.2% (Godlan, 2025). A flat 85% target across every plant usually isn’t the right benchmark.
Can Power BI connect directly to MES and SCADA systems?
Yes. Power BI connects to SCADA historian databases through SQL Server, to MES platforms through APIs, and to shop floor sensors through OPC-UA bridges like Azure IoT Hub. Most legacy systems still need a connector layer in between, not a direct plug-in.
How long does it take to build a real-time Power BI OEE dashboard?
Timelines depend on the approach. Buying OEE software typically takes 4 to 8 weeks. A partner-led build usually takes 8 to 12 weeks. Building fully in-house can take 6 to 12 months, depending on your IT team’s bandwidth.
What data does an OEE dashboard actually need?
At minimum, you need run time and downtime data from your machines or MES, cycle time and output counts, and quality or scrap data from your quality system. Missing any one of these produces an incomplete OEE number.
Is Power BI enough on its own, or do I still need OEE software?
Power BI is a reporting and visualization layer, not a data collection system. It needs clean, timely data from somewhere, whether that’s dedicated OEE software, your MES, or a custom pipeline built by a partner.
How often should OEE data refresh to count as real time?
There’s no single fixed number, but most manufacturers treat anything from a few seconds to a couple of minutes as real time. A refresh of once per hour or once per shift doesn’t meet that bar, even if the dashboard looks live.
What’s the difference between manual and automated OEE tracking?
Manual tracking relies on operators logging downtime and output by hand, which tends to overstate performance. Automated, machine-connected tracking captures the same data directly from equipment and is typically 8 to 15 percentage points more accurate (Fabrico, 2026).
Author By

Kamal Sharma
Kamal brings over 20 years of experience in data analytics and business intelligence. He has led the design and implementation of analytics solutions across operations, financial reporting, and performance improvement initiatives. With a background in business statistics and Six Sigma, his work focuses on applying data in a structured and practical way to solve real business challenges.