Power BI workspaces offer two primary ways to view your content: List View and Lineage View. While List View provides a flat, tabular inventory of every item in a workspace, Lineage View reveals the hidden relationships and data dependencies that connect your data sources, semantic models, reports, and dashboards. For anyone managing complex BI environments, understanding when to use each view is essential for impact analysis, troubleshooting, and governance.
What Is the Power BI Service Lineage View?
The Power BI Service lineage view is an interactive graphical representation of how artifacts within a workspace depend on each other. Every workspace in Power BI automatically includes a lineage view, which displays the flow of data from its source through semantic models to reports and dashboards.
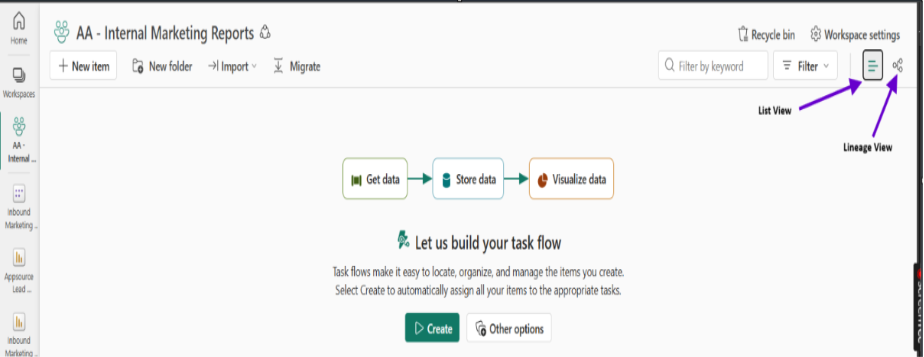
To access it, navigate to a workspace, open the View dropdown, and select Lineage. You can also click the lineage icon in the workspace menu bar – two circles connected by a line.
List View vs Lineage View: Key Differences
| Aspect | List View | Lineage View |
| Display | Flat table with columns | Graphical dependency graph |
| Purpose | Browse and manage individual items | Understand relationships and data flow |
| Shows dependencies | No | Yes, upstream and downstream |
| Cross-workspace visibility | Limited | Yes, external datasets appear |
| Impact analysis | Not available | Built-in via impact buttons |
| Best for | Quick item lookup | Troubleshooting and governance |
List View is the default experience. It presents every artifact – semantic models, reports, dashboards, dataflows – as rows with metadata like name, type, and owner. This is useful when you know what you’re looking for and simply need to open, rename, or delete an item.
Lineage View, by contrast, arranges content into connected clusters. A data source card appears on the left, connected by lines to the semantic models built on it, which in turn connect to downstream reports and dashboards. This visual layout makes it immediately obvious that changing a semantic model will affect specific reports.
How Power BI Data Lineage Works
When you open lineage view, Power BI maps relationships based on how artifacts reference each other. The graph flows from left to right: data sources → semantic models and dataflows → reports → dashboards.
Key elements you’ll see on artifact cards include:
- Last refresh time on semantic models, helping you spot stale data
- Certification or promotion status, indicating trust level
- Gateway information for on-premises data sources
- External workspace links when a dataset lives in another workspace
If a report uses a semantic model from a different workspace, that model appears as an external card. Clicking the workspace name navigates you there without leaving lineage view.
Using Impact Analysis with Lineage View
The real power of the lineage view emerges during impact analysis. Before modifying a semantic model or taking a data source offline, you need to know what will break.
Semantic Model Impact Analysis
Select the impact analysis button on any semantic model card. Power BI displays all downstream reports and dashboards across every workspace that references that model. This works even for models shared across multiple workspaces, where dependencies are otherwise difficult to trace.
Data Source Impact Analysis
Similarly, clicking impact analysis on a data source card reveals every semantic model and dataflow that connects to it. This is invaluable when a database is being migrated or deprecated.
Practical Example: Tracing a Broken Report
Suppose a dashboard shows stale data. In List View, you see the dashboard and its last refresh timestamp, but nothing tells you why it’s outdated. Switch to Lineage View, and you can trace backwards: the dashboard depends on a report, which uses a semantic model, which connects to a SQL Server source via a gateway. The gateway card might show a connection issue, or the semantic model card might reveal a failed refresh. What would have required investigating three separate items in List View becomes a single visual inspection in Lineage View
Permissions and Limitations
Lineage view requires a Power BI Pro license and at least a Contributor role in the workspace. Users with only Viewer access cannot switch to lineage view because they lack access to underlying datasets.
Additional limitations:
- Lineage view is not available in Internet Explorer
- Correct semantic model-to-dataflow lineage requires connections set up through the Get Data UI with the Dataflows connector; manually created Mashup queries may not display correctly
- Viewer role cannot access lineage view at all
For column-level lineage that traces individual fields through transformations, you’ll need Microsoft Purview or third-party tools. Power BI’s native lineage view operates at the artifact level, not the column level.
When to Use Each View
Use List View when:
- You need to quickly find and open a specific report or model
- You’re performing bulk actions like deleting or moving items
- You want to see ownership and modification dates at a glance
Use Lineage View when:
- Assessing the impact of planned changes
- Troubleshooting refresh failures or data discrepancies
- Onboarding to an unfamiliar workspace to understand its architecture
- Auditing dependencies before deprecating a data source
- Documenting data flows for governance or compliance
Frequently Asked Questions
What is the Power BI lineage view?
The Power BI lineage view is a graphical representation showing how data flows from sources through semantic models to reports and dashboards within a workspace, including external dependencies across workspaces.
How do I access lineage view in Power BI Service?
Open a workspace, select Lineage from the View dropdown in the ribbon, or click the lineage icon in the workspace menu bar. You need at least Contributor role and a Pro license.
What is the difference between list view and lineage view?
List view is a flat, tabular listing of all workspace items. Lineage view is a dependency graph showing relationships and data flow between artifacts.
Can I see datasets from other workspaces in lineage view?
Yes. External semantic models appear as cards with a link to their source workspace. You can navigate to that workspace directly from lineage view.
Does lineage view show column-level dependencies?
No. Power BI’s native lineage view operates at the artifact level (semantic models, reports, dashboards). Column-level lineage requires Microsoft Purview or third-party solutions.
Conclusion
The Power BI Service lineage view complements rather than replaces List View. List View remains the fastest way to browse and manage individual items. But when you need to understand what depends on what – to prevent breaking reports, to plan migrations, or to document your data architecture – lineage view provides the visual dependency map that List View cannot. Make switching between the two views a habit, and you’ll catch dependency issues before they become production incidents.
Author By

Rajeshwari Sharma
Rajeshwari is an experienced data professional with a track record of using data-driven insights to improve business performance. She has successfully managed multiple projects, utilising her expertise in data analysis and database administration. As a Microsoft-certified Data Analyst and Azure Database Administrator, she has cultivated a deep understanding of data management best practices and advanced analytics techniques. Her MBA in Business Analytics has equipped her with a solid foundation for integrating business strategy with data insights.