TL;DR
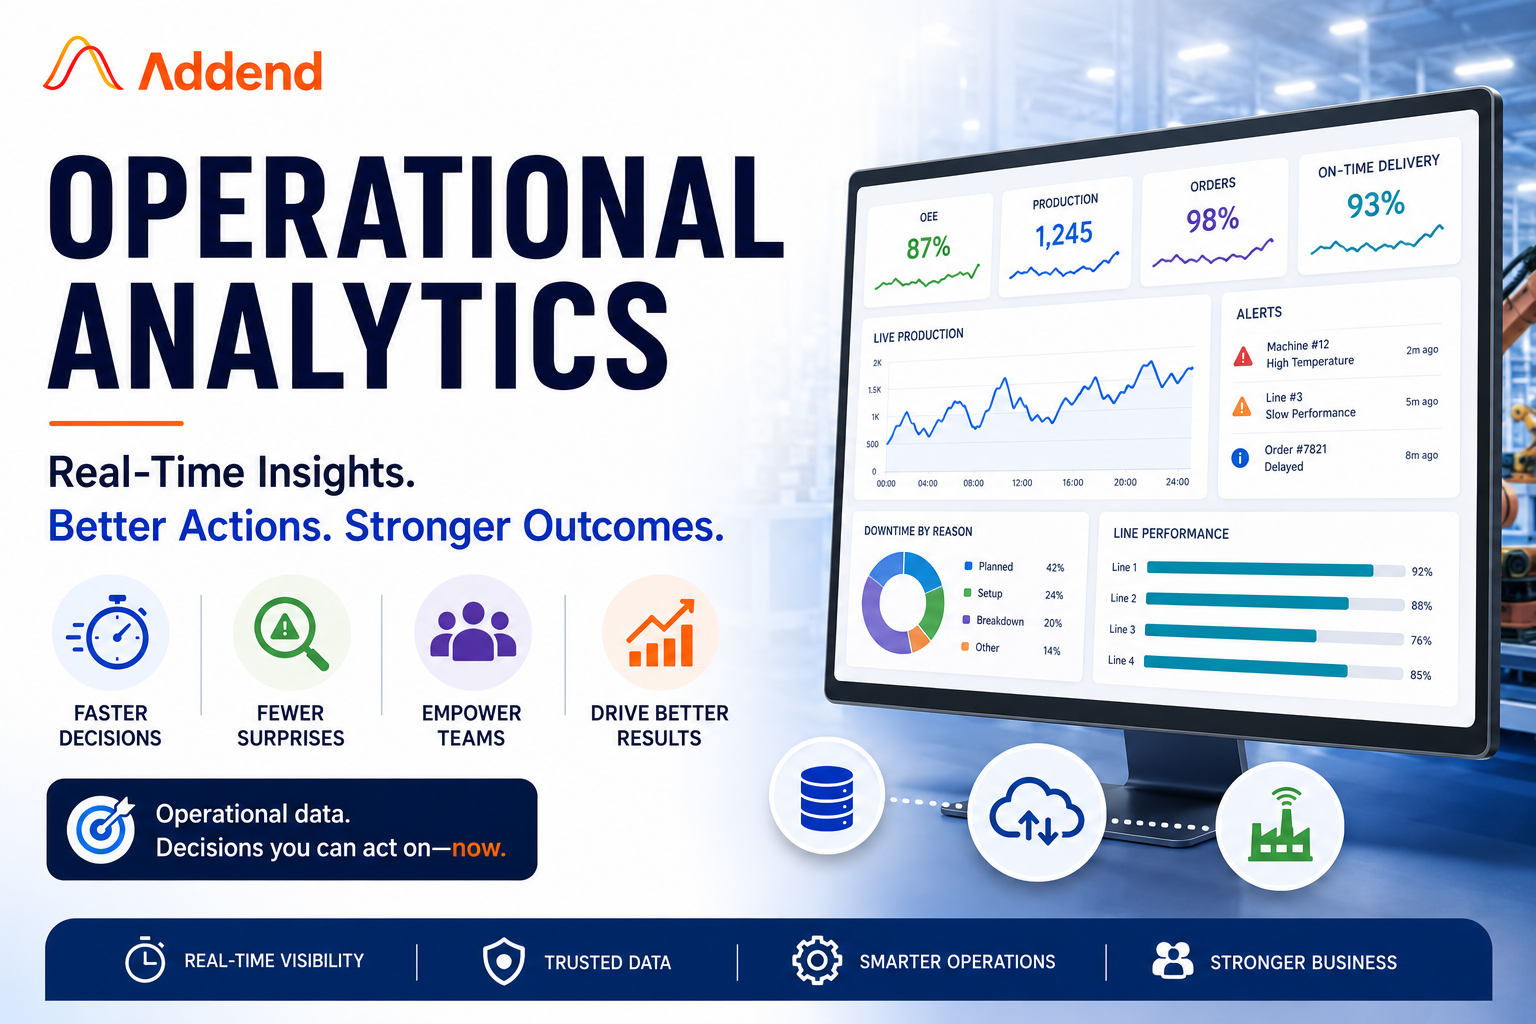
Operational analytics helps businesses make faster decisions using live data such as production output, inventory levels, order status, and customer support tickets. Instead of relying on historical reports like traditional Business Intelligence (BI), it provides real-time insights that frontline teams can act on immediately. In this guide, you’ll learn what operational analytics is, how it works, the tools that support it (including Microsoft Power BI and Microsoft Fabric), common implementation challenges, and practical steps to get started with a focused use case.
What Is Operational Analytics?
Every business generates data every minute. The real challenge is using that data before the opportunity to act is gone. Operational analytics helps teams make faster decisions by turning live business data into real-time insights.
Unlike traditional Business Intelligence (BI), which focuses on past performance, operational analytics gives frontline teams the information they need to respond as events happen. It works alongside BI, helping businesses solve problems faster and make better day-to-day decisions.
Operational analytics fails less often from bad data than from unclear ownership. Someone has to be accountable for the number, not just the dashboard it lives on.
5 Key Components Of Operational Analytics
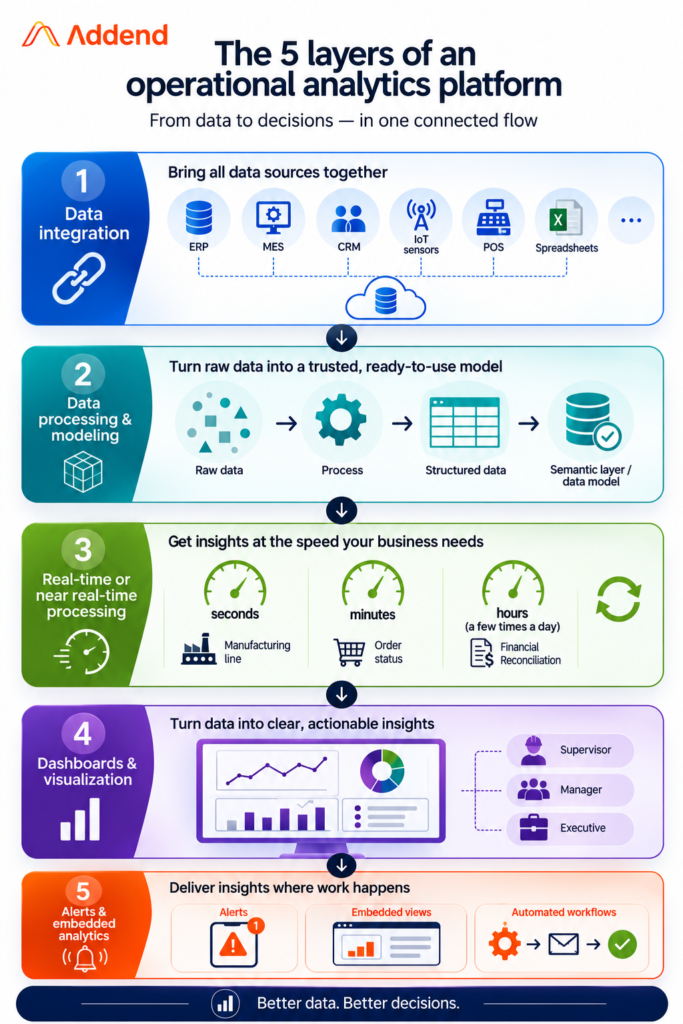
Operational analytics platforms vary in complexity, but most share a common structure.
1. Data Integration
Operational data typically lives in multiple systems ERPs, MES platforms, CRMs, spreadsheets, IoT sensors, point-of-sale systems. The first step is connecting these sources so information can be viewed together instead of in isolated silos. This is often the least visible part of the process and, in practice, the part that determines whether everything built on top of it can be trusted. This is exactly where Addend Analytics’ Microsoft Fabric services typically come in, connecting scattered ERP, CRM, and sensor data into a single governed foundation.
2. Data Processing and Modeling
Raw data from different systems rarely lines up cleanly different formats, different naming conventions, different update frequencies. This layer standardizes and organizes t he data into a structure that’s consistent and query-ready, often called a semantic layer or data model, so the same metric means the same thing no matter who’s looking at it.
3. Real-Time or Near-Real-Time Processing
Depending on the use case, data might be refreshed every few seconds (a manufacturing line), every few minutes (order status), or a few times a day (financial reconciliation). The point isn’t that everything needs to be instantaneous it’s that the refresh rate matches how quickly a decision actually needs to be made. This is also where “real-time operational analytics” fits in: it’s not a separate discipline, just the sub-set of operational analytics where the decision genuinely can’t wait more than a few seconds a production line or a live trading desk, as opposed to a project profitability dashboard that’s just as useful refreshed daily.
4. Dashboards and Visualization
This is the most visible layer the operational analytics dashboard that a supervisor, manager, or executive actually looks at. Good operational dashboards are built around the decisions someone needs to make, not around every metric that could theoretically be shown.
5. Alerts and Embedded Analytics
Rather than requiring someone to check a dashboard proactively, mature operational analytics setups push relevant information to people through alerts, embedded views inside the tools they already use, or automated workflows so the insight reaches the decision-maker instead of waiting to be found.
How To Get Started With Operational Analytics: A 5-Step Approach
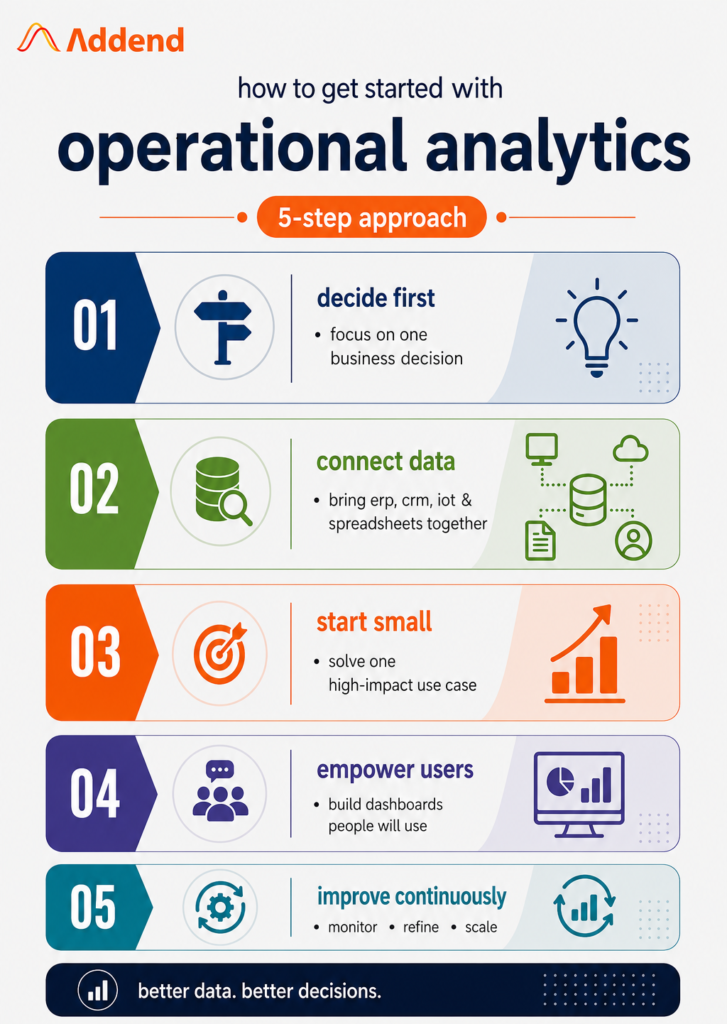
Getting started with operational analytics doesn’t require a major transformation. Follow these five practical steps to build a strong foundation and deliver value faster.
1. Start With A Decision, Not A Dashboard
Focus on a specific business decision that’s slowed by outdated or disconnected data, such as production planning or inventory replenishment. When you start with the decision, it’s easier to identify the right data, metrics, and refresh frequency.
2. Know Where Your Data Lives
Identify the systems that hold the data you need, whether it’s an ERP, CRM, spreadsheets, or machine sensors. Trusted analytics starts with trusted data, so understanding your data sources is essential before building dashboards.
3. Start Small And Prove The Value
Begin with one team, one process, or one business unit instead of trying to solve everything at once. A successful pilot builds confidence, demonstrates quick wins, and makes future expansion much easier.
4. Involve The People Who Use It
The people making day-to-day decisions should help shape the dashboards they’ll rely on. Their feedback improves usability, increases trust, and encourages adoption across the organization.
5. Keep Improving Over Time
Operational analytics is an ongoing capability, not a one-time project. As business goals, processes, and data change, your dashboards and metrics should evolve to stay relevant.
You don’t need years to see results. Many organizations achieve measurable improvements within weeks by focusing on one high-impact use case and expanding from there.
Why Operational Analytics Matters In 2026
Operational analytics has moved from being a nice-to-have capability to a business necessity. Several business and technology trends are driving this shift, making it harder for organizations to compete without timely, data-driven decisions.
1. Operations Have Become More Distributed
Today’s businesses operate across multiple locations, suppliers, warehouses, and customer sites. Teams are no longer working from the same office or relying on a single system. To make informed decisions, they need access to accurate and up-to-date data, no matter where they are. Operational analytics brings this information together, so everyone is working from the same view.
2. Customers Expect Immediacy
Customers now expect quick updates on their orders, faster service, and accurate delivery information. Waiting hours or days to respond is no longer acceptable. Operational analytics gives teams real-time visibility, helping them respond faster, resolve issues sooner, and deliver a better customer experience.
3. Businesses Can No Longer Afford To Rely On Guesswork
Whether it’s a production delay, an idle machine, an unbilled hour, or an inaccurate demand forecast, small operational issues can quickly impact profitability. Operational analytics helps businesses identify these problems as they happen, giving teams the opportunity to act before they become expensive.
4. Real-time Analytics Is More Accessible Than Ever
Not long ago, building a real-time analytics solution required expensive infrastructure and significant technical expertise. Today, platforms like Microsoft Fabric, Power BI, Azure Synapse, and similar cloud technologies have made it much easier for businesses of all sizes to connect their data and build real-time dashboards without a lengthy implementation.
5. Leaders Want To Spend Less Time Validating Data And More Time Making Decisions
Many organizations still spend valuable meeting time comparing reports and debating which numbers are correct because different teams rely on different data sources. Operational analytics creates a single, trusted view of business data, allowing leaders to focus on solving problems and making decisions instead of reconciling numbers.
Operational Analytics Across Industries: 5 Use Cases
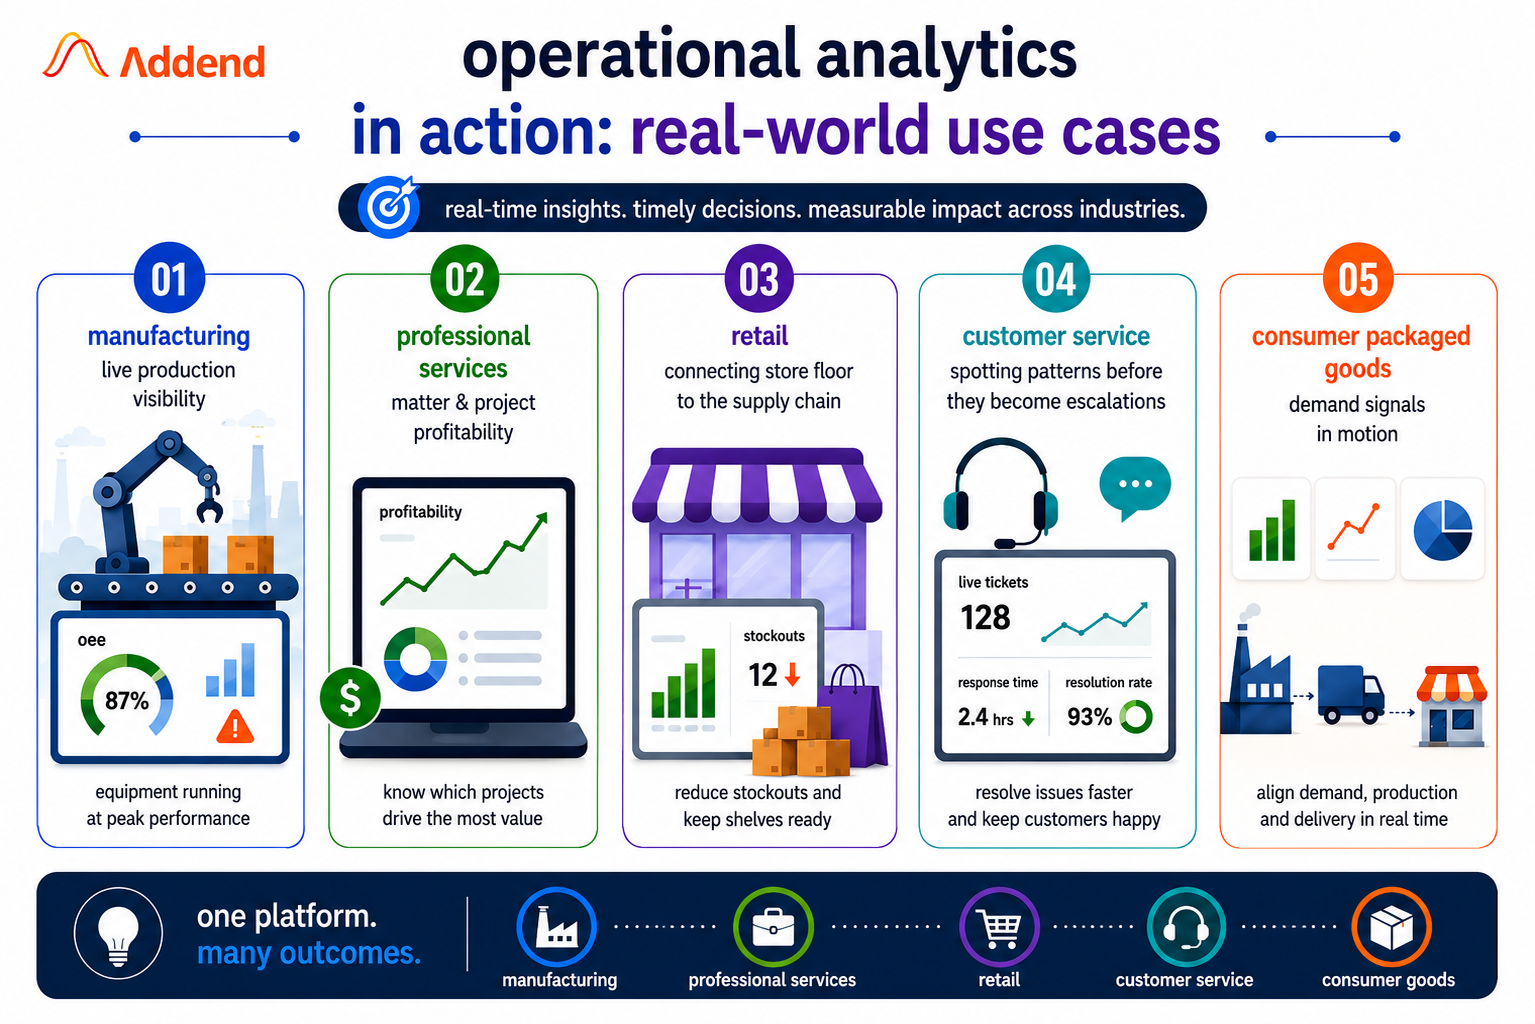
Operational analytics looks different in every industry, but the goal is always the same: helping teams make better decisions while there’s still time to act. Here are a few examples of how businesses use it in the real world.
- Manufacturing: Live Production Visibility
Many manufacturers still rely on end-of-shift reports to understand machine performance. By the time a plant manager sees a report showing excessive downtime, the shift is already over and the opportunity to recover lost production is gone.
With operational analytics, machine sensor data, quality checks, and production output are monitored in near real time. A live dashboard tracking metrics such as Overall Equipment Effectiveness (OEE) allows supervisors to spot potential issues as they develop. Instead of reacting after production stops, they can schedule maintenance, reroute work, or resolve the issue before it affects the entire production line.
- Professional Services: Improving Project Profitability
Law firms, consulting firms, and other professional services businesses often realize a project has exceeded its budget only after invoices are prepared. By then, it’s too late to adjust staffing, pricing, or project scope.
Operational analytics combines time tracking, billing, and resource utilization data into a single view. This gives partners and project managers real-time visibility into project profitability, helping them make informed decisions while the engagement is still in progress.
- Retail: Connecting the Store Floor to the Supply Chain
Retailers often manage sales, inventory, and supplier data across different systems. As a result, stockouts or excess inventory are sometimes discovered only after they have already affected sales.
Operational analytics brings these data sources together into one live view. Store managers and supply chain teams can monitor inventory levels, respond to changing demand, and make faster replenishment and staffing decisions based on what’s happening today, not last week’s reports.
- Customer Service: Spotting Patterns Before They Become Escalations
Support teams handle thousands of customer interactions every day. Without real-time visibility, patterns such as a product defect, billing issue, or service outage may only become obvious after customer complaints have grown.
Operational analytics tracks ticket volume, response times, and resolution trends in real time. This allows support teams to identify emerging issues early, resolve them faster, and reduce the impact on customers.
- Consumer Packaged Goods: Demand Signals in Motion
A CPG company monitoring point-of-sale data, distributor inventory, and promotional performance in near real time can adjust production and distribution plans within days rather than finding out at month-end that a promotion under- or over-performed.
Across every one of these use cases, the value of operational analytics is the same. Instead of discovering problems after the opportunity to act has passed, businesses get timely insights that help them make better decisions when they can still influence the outcome.
Signs Your Organization Needs Operational Analytics
Not sure if your business needs operational analytics? Start with a quick reality check. If any of the situations below sound familiar, there’s a good chance your teams could benefit from faster, more reliable access to operational data.
- Meetings begin with teams comparing numbers instead of discussing solutions.
- Reports arrive after the opportunity to act has already passed.
- Different departments calculate the same KPI differently, making it difficult to agree on the “right” number.
- Frontline managers rely on experience or manual checks instead of real-time data to make daily decisions.
- Leadership learns about production delays, quality issues, budget overruns, or service problems only during weekly or monthly reviews, when it’s often too late to prevent the impact.
If two or more of these sound familiar, operational analytics could help your organization move from reacting to problems after they occur to making informed decisions while there’s still time to act.
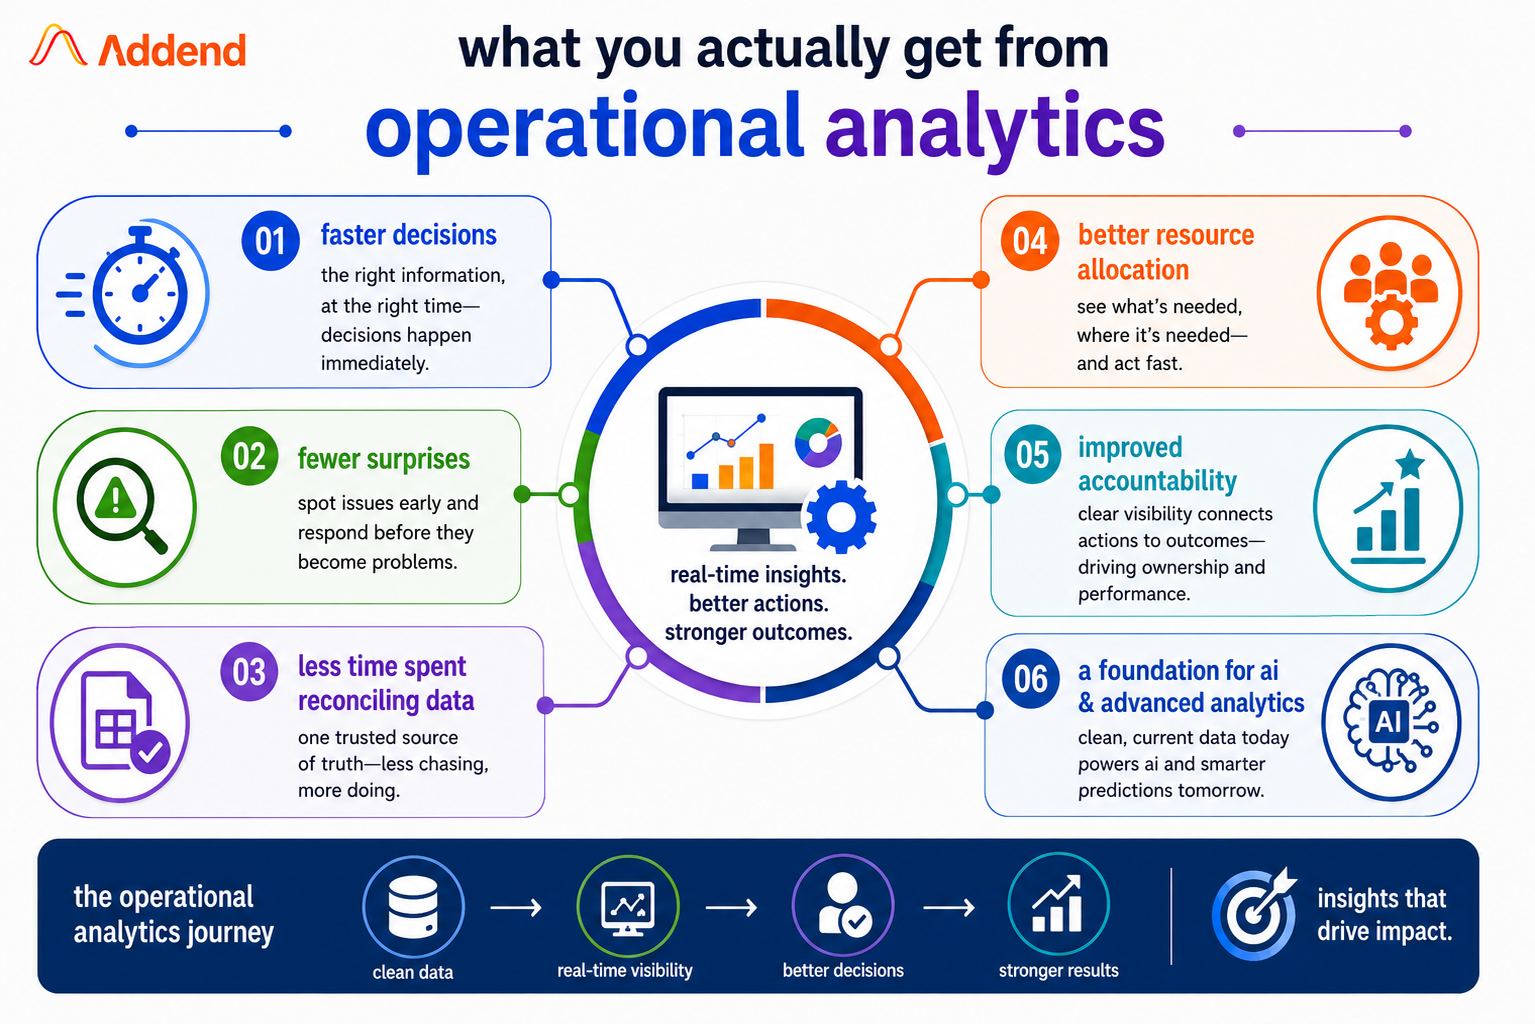
What You Actually Get From Operational Analytics
The biggest value of operational analytics isn’t more dashboards. It’s giving your teams the right information at the right time so they can make faster, smarter decisions. Here’s what that looks like in practice.
- Faster Decisions
When the right people have access to real-time information, they don’t have to wait for the next review meeting to take action. Problems can be identified and resolved as they happen, helping teams respond faster and keep operations moving.
- Fewer Surprises
Production delays, quality issues, missed delivery dates, or budget overruns rarely happen overnight. Operational analytics helps teams spot these issues early, giving them time to take corrective action before they become bigger problems.
- Less Time Spent Reconciling Data
Many organizations spend valuable time comparing spreadsheets and validating reports before they can even begin discussing solutions. Operational analytics provides a single, trusted view of business data, allowing teams to focus on decisions instead of debating the numbers.
- Better Resource Allocation
Real-time visibility into machine performance, workforce utilization, and inventory levels helps managers respond to changing conditions quickly. Resources can be shifted where they’re needed most, improving efficiency and reducing waste.
- Improved Accountability
When performance data is visible and up to date, teams have a clear understanding of how their actions affect business outcomes. This creates greater ownership, encourages collaboration, and supports continuous improvement.
- A Foundation For AI And Advanced Analytics
Capabilities such as predictive maintenance, demand forecasting, and AI-driven recommendations all rely on accurate, reliable operational data. Organizations that invest in operational analytics today are better prepared to adopt advanced analytics and AI solutions in the future.
Operational analytics is not a replacement for strategic planning or business intelligence. Its purpose is to support day-to-day operational decisions by giving teams timely, reliable information. Long-term planning still depends on historical trends, business context, and strategic analysis. Together, they help organizations make better decisions at every level.
Tools That Power Operational Analytics
There isn’t a single tool that delivers operational analytics. Instead, organizations combine different technologies that work together to collect, process, analyze, and act on operational data. The right mix depends on your business needs, existing systems, and data maturity.
Business Intelligence And Visualization Tools
These tools like Microsoft Power BI are commonly used to build the dashboards and reports that operational teams interact with daily. These platforms have matured significantly, offering near-real-time refresh capabilities and embedded analytics that can live directly inside line-of-business applications. This is the layer where Addend Analytics’ Power BI consulting services typically come into play, turning connected data into dashboards teams use.
- Microsoft Power BI
Microsoft Power BI is one of the most widely used BI platforms, offering seamless integration with Excel, Microsoft Teams, Azure, and hundreds of other data sources. It’s a popular choice for organizations already using the Microsoft ecosystem.
- Tableau
This is known for its highly interactive visualizations and advanced data exploration capabilities. It’s often preferred by organizations that require flexible dashboards and deeper analytical insights.
- Qlik Sense
This uses an associative data model that allows users to explore relationships between datasets without predefined queries. This makes it useful for organizations that need to analyze operational data from different perspectives.
Data Integration and Engineering Platforms
Before dashboards can deliver meaningful insights, data from different business systems must be connected, cleaned, and standardized. These platforms create the trusted data foundation that operational analytics depends on.
- Microsoft Fabric
This brings data integration, engineering, analytics, and Power BI together in one unified platform. By reducing the need for multiple disconnected tools, it simplifies the process of building and managing operational analytics solutions.
- Azure Synapse Analytics
This combines data warehousing and big data processing, making it suitable for organizations that need to analyse both structured and large-scale operational data.
- Snowflake
Snowflake is a cloud-native data platform that allows businesses to store and process large volumes of operational data efficiently. Its flexible architecture makes it a common choice for organizations bringing together data from multiple systems.
- Databricks
Databricks specializes in large-scale data engineering and machine learning. It’s often used when operational analytics expands into advanced use cases such as predictive maintenance, demand forecasting, or AI-driven analytics.
IoT and Sensor Platforms
Industries such as manufacturing and logistics rely on connected devices to monitor equipment and operations in real time. These platforms stream live sensor data into analytics solutions, enabling continuous visibility.
- Azure IoT Hub
It securely connects and manages IoT devices while streaming machine and sensor data into cloud analytics platforms. It’s commonly used with Microsoft Fabric and Power BI to build live production and equipment monitoring dashboards.
Workflow and Automation Tools
Insights create value only when they lead to action. Workflow automation tools help organizations respond automatically when important events occur.
- Power Automate
This enables businesses to trigger alerts, approvals, notifications, and automated workflows based on operational data. Instead of relying on someone to monitor a dashboard, the right information reaches the right people at the right time.
Choosing the Right Toolset
The best operational analytics solution isn’t built around a single product. It combines the right technologies to support your business goals, existing systems, and operational processes.
Many organizations focus too much on selecting a tool and not enough on building a strong data foundation. In practice, success depends less on the technology itself and more on how well your data is integrated, governed, and made available to the people who need it.
A manufacturing metric combining availability, performance, and quality into one score for how well equipment is being used.
The standardized layer that defines what a metric means, so “on-time delivery” adds up the same way across every team’s dashboard.
Mean Time to Respond / Mean Time to Detect—how quickly a team notices and reacts to an operational issue.
Dashboards or insights built directly into the software a team already uses daily, rather than a separate tool they have to open.
What Makes an Effective Operational Analytics Dashboard?
A dashboard isn’t valuable just because it displays real-time data. The best operational dashboards help people make faster, better decisions. Here are the characteristics that set them apart.
It’s Built Around a Specific Decision
A good dashboard is designed with a clear purpose. For example, a plant supervisor needs information to decide whether production should continue or stop, while an executive needs a high-level view of business performance. Trying to meet both needs with a single dashboard often creates confusion instead of clarity.
It Shows the Right Level of Detail for Its Audience
More data doesn’t always mean better decisions. Frontline teams need a focused set of metrics that update frequently, while leadership teams usually need broader insights with less frequent updates. Showing the right information to the right audience makes dashboards easier to use and more effective.
It’s Trusted
A dashboard is only as useful as the data behind it. If different departments question the numbers or calculate metrics differently, people will stop relying on it. Consistent, accurate, and well-governed data builds confidence and encourages adoption.
It Drives Action
The best dashboards don’t just display information. They help users understand what needs attention and when to act. Clear alerts, thresholds, and visual indicators make it easier to identify issues and respond before they become bigger problems.
It’s Easy to Access
If users have to switch between multiple systems or go looking for a dashboard, they’re less likely to use it regularly. Dashboards work best when they’re available within the tools employees already use, making insights part of everyday decision-making rather than an extra task.
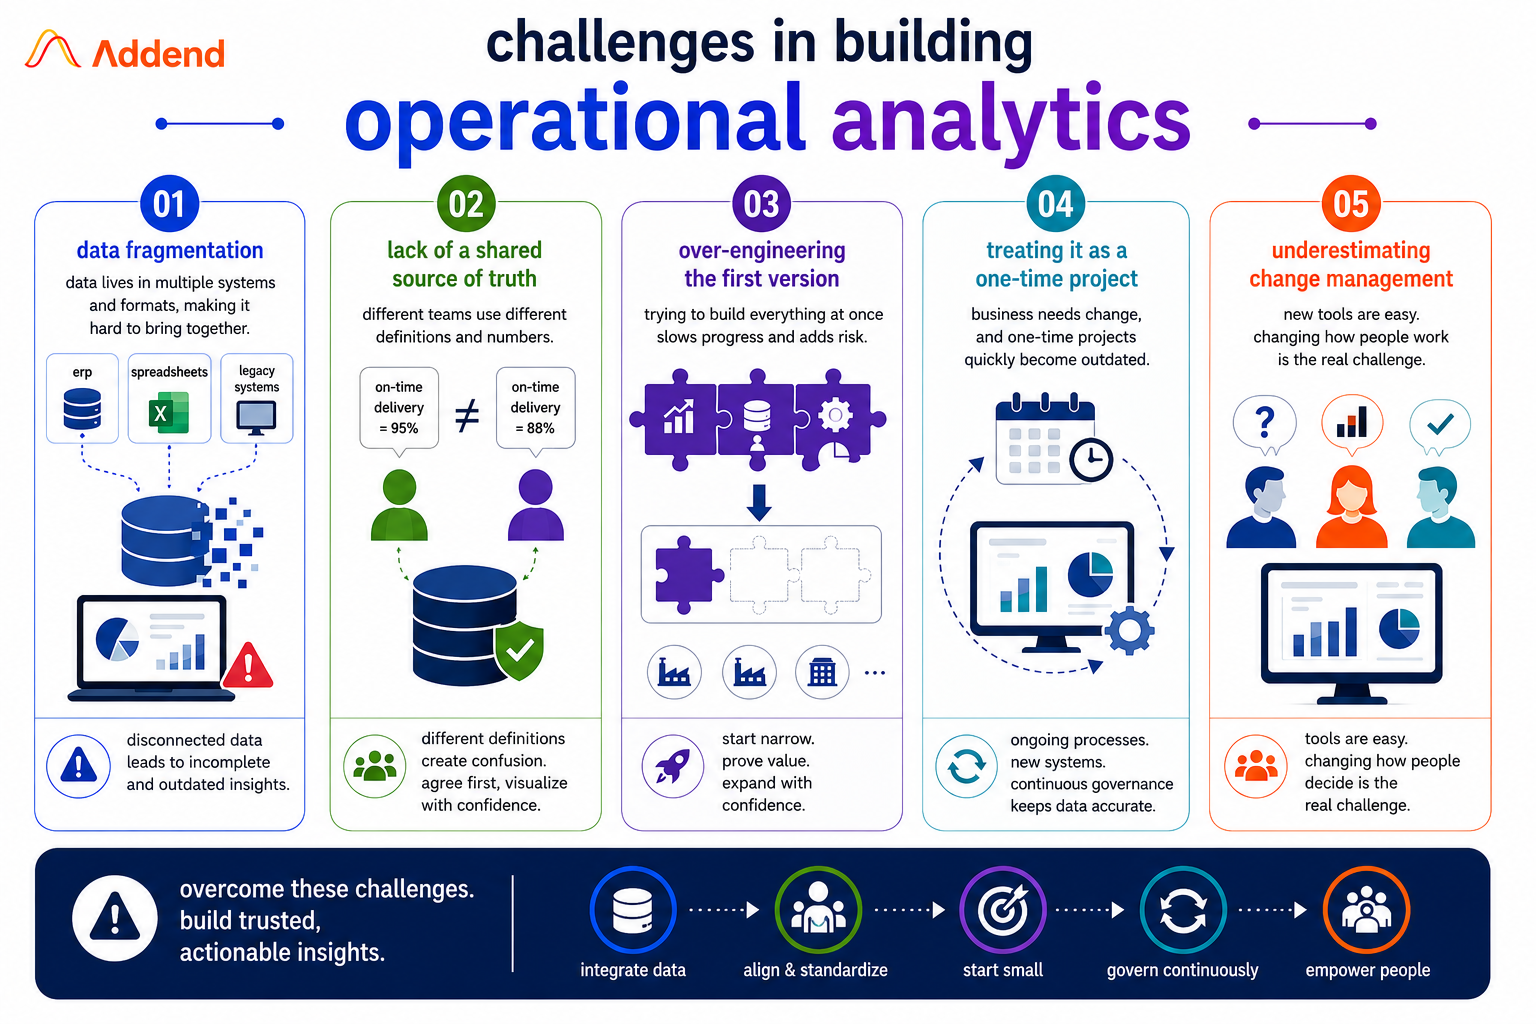
Challenges in Building Operational Analytics
Building an operational analytics solution isn’t just about choosing the right technology. Many projects face the same challenges, regardless of the industry. Understanding these common roadblocks can help you avoid costly mistakes and improve the chances of a successful implementation.
Data Fragmentation
Operational data is often spread across ERP systems, spreadsheets, legacy applications, IoT devices, and departmental tools that don’t naturally work together. Without proper integration, dashboards rely on incomplete or outdated data, making it difficult for teams to trust the insights they provide.
Lack Of A Shared Source Of Truth
If different teams calculate the same KPI in different ways, disagreements are inevitable. For example, two departments may each have their own definition of “on-time delivery.” Before building dashboards, organizations need to agree on how key metrics are defined so everyone works from the same trusted data.
Trying to Do Everything at Once
Many organizations try to build a company-wide analytics platform before proving its value. This often leads to long implementation cycles and unnecessary complexity. Starting with one team, one process, or one business unit allows organizations to deliver quick wins, build confidence, and expand more effectively.
Treating It As A One-Time Project
Operational analytics is not something you build once and forget. As business processes evolve and new data sources are added, dashboards and data models need regular updates to stay accurate and relevant.
Underestimating Change Management
Even the best dashboard won’t deliver value if people don’t use it. Employees are more likely to trust and adopt a solution when they’re involved from the beginning and understand how it helps them make better decisions. Successful operational analytics is as much about people and processes as it is about technology.
From CEO to Plant Manager: Who Drives Operational Analytics?
Operational analytics isn’t owned by a single department. It sits at the intersection of business, operations, and technology, which is why many initiatives struggle. Success depends on different teams working toward the same goal.
Leadership sets the direction. CEOs and COOs create a data-driven culture by encouraging teams to make decisions based on current, reliable information and by supporting the first operational analytics initiatives.
IT and data teams build the foundation. CIOs and data leaders are responsible for integrating data, maintaining governance, and ensuring everyone works from a trusted source of information.
Operations and plant managers bring the solution to life. As the people who use dashboards every day, their feedback determines whether an analytics solution becomes part of daily operations or simply another report that goes unused.
BI and analytics teams bridge the gap between business needs and technology. They work closely with operational teams to turn business questions into meaningful dashboards and actionable insights.
The most successful operational analytics initiatives aren’t driven by one department. They succeed when leadership, IT, and operational teams work together from the beginning instead of treating analytics as an IT project.
Operational analytics is also one of the most practical starting points for digital transformation. Unlike large transformation programs that can take years to show results, operational analytics delivers measurable improvements in a shorter time while building the same foundations for long-term success, including data integration, governance, and process improvement.
Where Addend Analytics Fits In
At Addend Analytics, this is the layer of analytics we spend most of our time in helping manufacturing, professional services, CPG, and other operationally intensive businesses connect fragmented data sources and build decision-ready analytics and Power BI dashboards that hold up under real operational pressure, not just in a demo.
Much of that work starts underneath the dashboard, with the data engineering foundation that determines whether the numbers on screen can actually be trusted unifying data from ERPs, machines, and spreadsheets using platforms like Microsoft Fabric and Power BI so operational teams are working from one shared, current view rather than several conflicting ones.
For manufacturing organizations specifically, we’ve worked with plant leadership teams to replace end-of-shift reporting with live production visibility you can see how that plays out in practice through our manufacturing analytics work.
Key Takeaways
- Operational analytics turns live business data into decisions teams can act on immediately, not weeks later.
- It differs from BI mainly in speed and audience: BI looks backward for executives; operational analytics looks at “right now” for the frontline.
- Real-world impact spans manufacturing, retail, professional services, customer service, and CPG.
- Core benefits include faster decisions, fewer surprises, and a stronger foundation for future AI use cases.
- Most failures come from fragmented data, unclear ownership, and weak change management not the technology.
- Start with one narrow, high-value use case tied to a real decision, not a company-wide rollout.
Frequently Asked Questions
Common questions about operational analytics, how it works, and where it fits alongside traditional BI.
Author By

Kamal Sharma
Kamal brings over 20 years of experience in data analytics and business intelligence. He has led the design and implementation of analytics solutions across operations, financial reporting, and performance improvement initiatives. With a background in business statistics and Six Sigma, his work focuses on applying data in a structured and practical way to solve real business challenges.