TL;DR
This post untangles augmented, predictive, and generative AI analytics so you can tell them apart without a vendor’s pitch deck. You’ll see which capabilities may already be inside Power BI, what Copilot actually requires now that a 2025 licensing change lowered its entry cost, how to decide where to start based on your data’s current state, and the mistake that stalls most mid-market AI projects before they deliver anything.
Someone on your team probably said the phrase “AI-powered analytics” in a meeting this month. Maybe it was a software demo. Maybe it was a slide about Copilot. Maybe it was a LinkedIn post calling augmented analytics the next shift in business intelligence.
The trouble is that the phrase covers at least three different technologies: automated pattern discovery, forecasting models, and generative chat interfaces. Vendors blend them together because it sells software. If you run analytics or technology decisions at a 50 to 500 person company, conflating them costs real time and budget. Teams end up buying a chatbot when they needed a forecast, or a forecasting tool when their underlying data wasn’t clean enough to trust yet.
This post separates the three, explains where each one fits inside a Microsoft-centered BI stack, and walks through what Copilot for Power BI genuinely requires before your team commits budget to it.
What “AI-Powered Analytics” Really Covers
AI-powered analytics is not one product. It’s an umbrella term for any analytics process where machine learning or generative AI takes over part of the work an analyst used to do by hand. That work falls into three buckets: finding patterns automatically, predicting what happens next, and generating language or narrative around the data.
Most vendors use the term to describe all three at once, which is convenient on a sales page and confusing for a buyer. McKinsey’s most recent State of AI research found that 88 percent of organizations now report regular AI use in at least one business function, up sharply from 78 percent the year before. Most companies already have some form of AI touching their analytics. Few could tell you which type it is, or why the distinction matters.
“88% of organizations report regular AI use in at least one business function, up from 78% a year earlier.”
The distinction matters because each type solves a different problem and needs different groundwork underneath it:
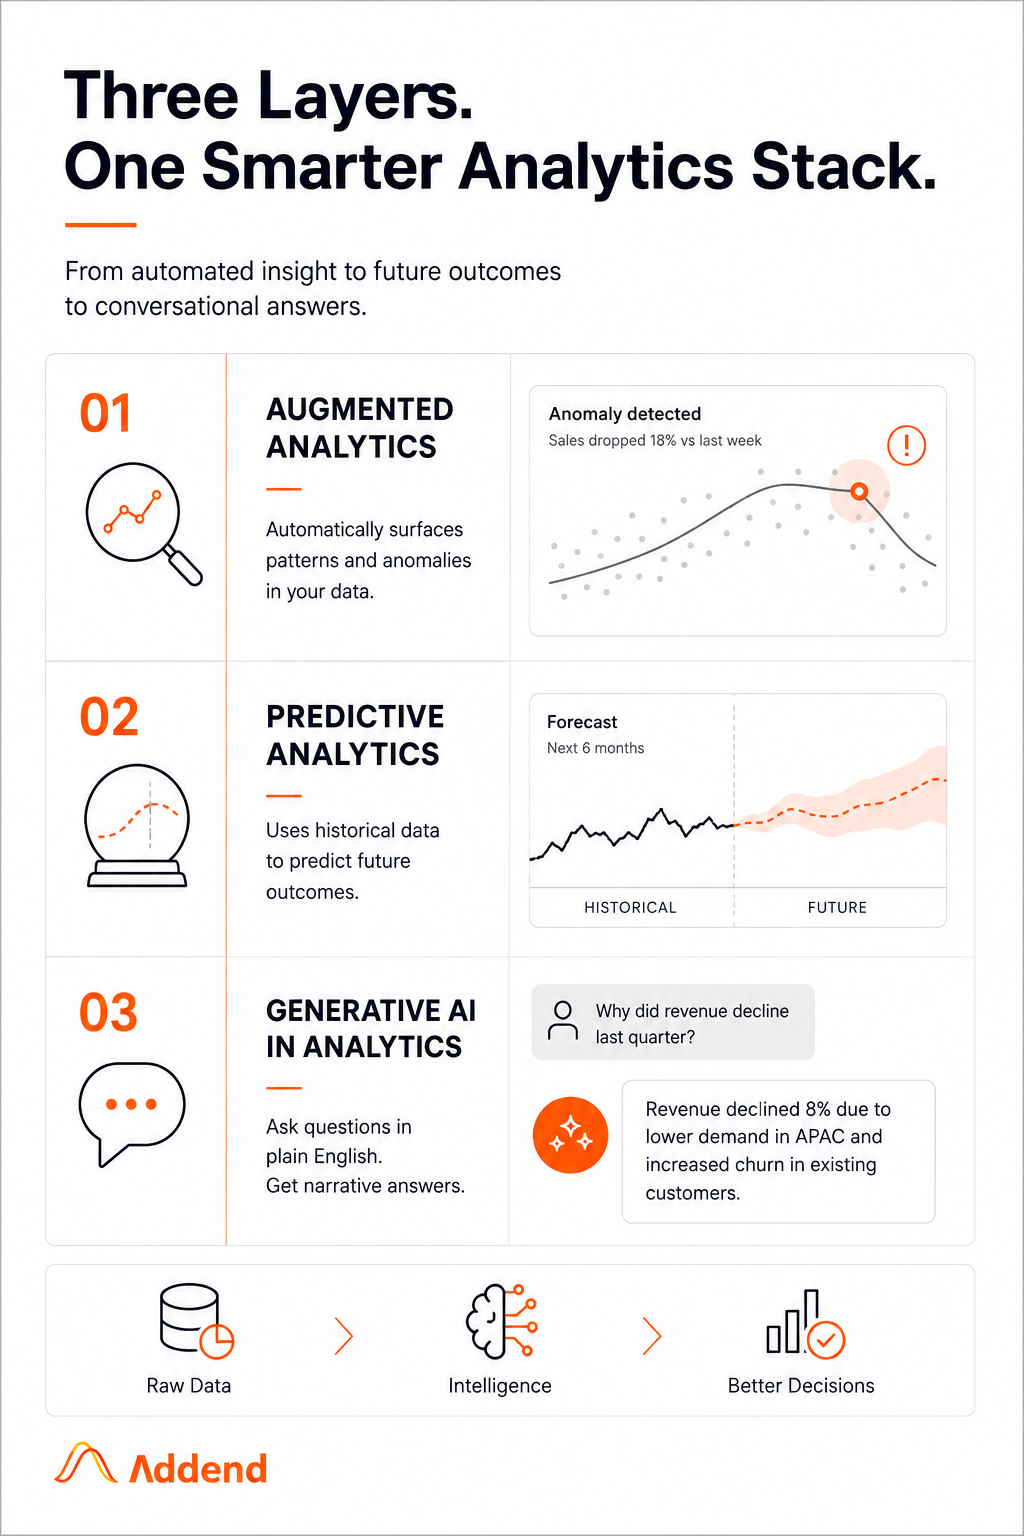
- Augmented analytics automates the discovery of patterns and anomalies you’d otherwise dig for manually inside a dashboard.
- Predictive analytics uses historical data to estimate a future outcome, such as churn risk, demand, or cash flow.
- Generative AI in analytics adds a language layer on top, letting people ask questions in plain English and get a narrative answer back.
Why This Matters for Mid-Market Companies In 2026
For years, augmented and predictive analytics lived mostly in enterprise budgets, tools with six-figure licensing, dedicated data science teams, and long implementation timelines. That’s changed for two reasons.
First, the capabilities themselves moved into tools mid-market companies already own. Power BI, the tool most Microsoft-centered companies already use for reporting, now ships with augmented and generative features built in rather than sold as a separate platform. Second, the cost of accessing the AI layer inside Fabric and Power BI dropped substantially in 2025, a point covered in detail later in this post.
Gartner expects this shift to keep accelerating. By 2027, the firm predicts that augmented analytics capabilities will evolve into autonomous analytics platforms that fully manage and execute a fifth of business processes on their own.
“By 2027, augmented analytics capabilities are expected to evolve into autonomous platforms handling 20% of business processes.”
That doesn’t mean your finance team needs an autonomous platform this quarter. It means the tools you’re already paying for are quietly becoming more capable, and the companies that figure out where to point that capability first will spend less time reconciling numbers in meetings and more time acting on them.
There’s a competitive angle here too. When augmented and predictive capabilities live inside the reporting tool your team already uses, the barrier to trying them drops from “new software purchase” to “turn on a setting and clean up a model.” Companies that treat this as a small, low-risk pilot tend to get a working answer within a quarter. Companies that wait for a formal enterprise AI initiative often spend that same quarter still writing the business case.
What Augmented Analytics Actually Automates
Augmented analytics is the least understood of the three terms, mostly because it sounds abstract. In practice, it means using machine learning to automate three specific tasks that analysts used to do manually: preparing data, finding insights in it, and explaining what those insights mean in plain language.
Inside Power BI, this shows up as automated anomaly detection on a visual, a Q&A style search box, or a narrative summary that flags what changed in a report without anyone asking it to. None of this replaces your analyst. It removes the first hour of every analysis, the part spent scrolling through a dashboard looking for what’s unusual before you can even start interpreting it.
Augmented analytics works best on data you already trust. It’s a poor fit for messy, ungoverned data, because it will surface patterns just as confidently in bad data as in good data. The output looks the same either way, which is exactly why data quality has to come first.
A few signs augmented analytics is worth piloting at your company:
1.Your team spends real time each week manually scanning reports for anomalies before a meeting.
2. You already have governed, well-labeled semantic models in Power BI, even if only for one or two departments.
3. Analysts are stuck doing repetitive first-pass analysis instead of interpretation and recommendations.
If none of those apply yet, augmented analytics isn’t the wrong idea. It’s just not the first project.
What’s Really New About Predictive Analytics for Enterprises
Predictive analytics is older and better understood than the other two categories, but it’s also the one most often oversold. It uses historical data and statistical or machine learning models to estimate a future number: next quarter’s demand, a customer’s churn probability, or the likelihood a project runs over budget.
What’s changed recently isn’t the underlying math. It’s accessibility. Building a predictive model used to require a data science team and a separate modeling environment. Now, tools inside the Microsoft stack, including Fabric’s data science workloads and Power BI’s built-in forecasting, let a smaller analytics team build and test a first model without standing up new infrastructure.
Forrester’s 2025 State of AI survey found that more than 70 percent of firms already have generative or predictive AI in production, but few are measuring its financial impact or validating it over time.
“Over 70% of firms already have generative or predictive AI in production, but few measure its financial impact.”
That gap between deployment and measurement is the real risk with predictive analytics. A forecast that looks precise but hasn’t been checked against real outcomes is worse than no forecast, because it invites confident decisions built on a number nobody validated. Before you roll a predictive model into a real decision, pilot it against one metric for a full cycle and compare the forecast to what actually happened.
Predictive analytics for enterprises works best when you start narrow. Pick one metric that already has a clean, consistent history, like monthly demand for your top product line or renewal likelihood for existing accounts, rather than trying to forecast everything at once.
Two failure modes show up repeatedly at mid-market companies. The first is forecasting a metric that changes for reasons the historical data never captured, like a new product line with no prior sales history. No model can predict what it has never seen. The second is building the model correctly, then never revisiting it once the business changes. A forecast trained on last year’s patterns quietly loses accuracy the moment your market, pricing, or customer base shifts, and nobody notices until a decision built on it goes wrong.
Generative AI in Analytics: Beyond the Chatbot
Generative AI in analytics is the layer most people picture when they hear “AI-powered analytics,” largely because it’s the most visible. It’s a chat interface that lets someone type a question in plain English and get an answer, a chart, or a written summary back.
That visibility is also why it gets adopted first and causes the most disappointment. A generative layer is only as accurate as the data model underneath it. Ask it a question your semantic model can’t answer well, and it will still generate a fluent, confident response. That’s not a flaw specific to any one vendor. It’s how large language models work: they’re built to produce a plausible answer, not to know when they don’t have one.
Gartner projects that by 2027, 75 percent of new analytics content will be shaped by generative AI to connect insights directly to actions, rather than sitting in a static report someone has to interpret manually.
That’s a meaningful shift, but it assumes the groundwork is in place. Generative AI in analytics earns its place once your reports are already trustworthy enough that a plain-English summary of them is worth reading. It’s the finishing layer, not the foundation.
Microsoft Copilot for Power BI: Cost, Access, and Readiness
For companies already running Power BI, Copilot is the most concrete example of generative AI in analytics available today, and the one your team has probably already heard about. It’s worth being specific about what it is, what it costs, and what it needs to work well, because a lot of the information circulating about it is out of date.
Licensing: What Changed in 2025
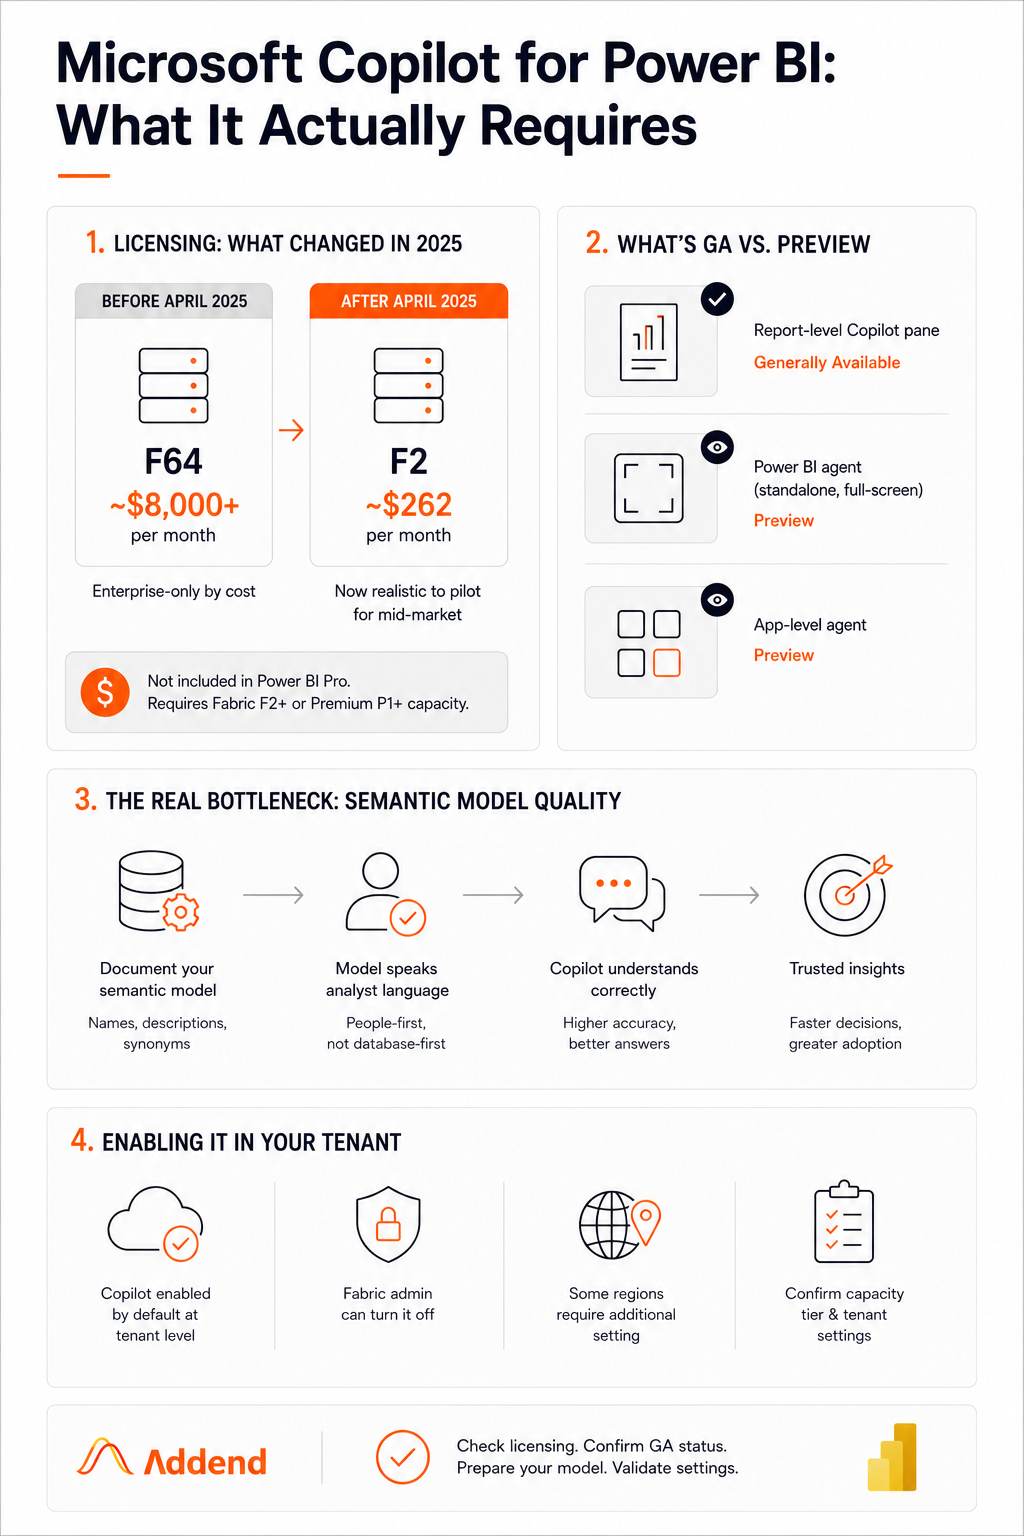
Copilot for Power BI is not included in a standard Power BI Pro license. It requires a paid Microsoft Fabric capacity of F2 or higher, or a Power BI Premium capacity of P1 or higher. A Pro or Premium Per User license alone does not turn it on.
Until April 2025, the practical minimum for Copilot was an F64 capacity, priced at roughly $8,000 or more per month, which put it firmly out of reach for most mid-market budgets. Since then, Microsoft extended Copilot support down to the F2 tier, priced at roughly $262 a month. That’s the correction worth knowing: Copilot for Power BI is no longer an enterprise-only feature by cost. It’s now realistic to pilot for a mid-market company, though usage is metered by tokens, so heavier use on a small capacity can get expensive quickly.
What’s Generally Available vs. Still in Preview
Not every Copilot experience is finished. The report-level Copilot pane, the assistant that appears alongside a report to answer questions about it, is generally available. The standalone, full-screen Power BI agent and the app-level agent are both still in preview. If a vendor demo shows you the full-screen experience as a finished product, ask directly whether that specific feature is GA or preview in your tenant.
The Real Bottleneck: Semantic Model Quality
Copilot’s answer quality depends almost entirely on how well your semantic model is documented, meaning clear field names, descriptions, and synonyms an analyst would recognize. This doesn’t require deep DAX expertise to fix. It requires someone taking the time to label your model the way a person, not a database, would describe it. Skip this step and Copilot will answer questions fluently and inaccurately, which is worse than not having it at all.
Enabling It in Your Tenant
Copilot is enabled by default at the tenant level, but a Fabric admin can turn it off, and some organizations outside the US or EU data boundary need an additional setting enabled before the standalone experience works. Confirm both your capacity tier and your tenant settings before you promise Copilot to a business team as part of a rollout.
Where Mid-Market Teams Go Wrong, and How to Fix It
| Approach | What Most Mid-Market Teams Do | What Works Better | Why It Matters |
| Getting started | Buy a generative AI chatbot first because it’s the most visible demo | Start with augmented analytics on your existing Power BI models | Automated insight discovery needs less data prep and shows value in weeks, not months |
| Forecasting | Ask a BI tool to “predict” a number without validating it against real outcomes | Pilot predictive analytics on one metric and track accuracy for a full cycle | A confident wrong forecast is worse than no forecast at all |
| Copilot rollout | Assume Copilot needs an expensive Fabric tier and shelve the idea | Check current Fabric capacity pricing before ruling it out | The entry point dropped from roughly $8,000 to about $262 a month in 2025 |
| Data readiness | Treat data cleanup as a separate project from the AI rollout | Treat semantic model quality as the first deliverable, not an afterthought | Every AI layer inherits the accuracy problems of the data model underneath it |
Most AI-powered analytics disappointments trace back to sequencing: chasing the most visible layer before the data underneath it is ready.
A mid-size specialty manufacturer. A 200-employee manufacturer was reporting production costs and downtime through a mix of spreadsheets and a legacy Power BI report nobody fully trusted. Leadership wanted a chat-style tool so plant managers could “just ask” about performance without waiting on a monthly report.
Instead of starting there, the team spent six weeks consolidating machine and ERP data into a single governed semantic model and turned on augmented anomaly detection inside their existing Power BI dashboards. Plant managers started seeing flagged cost spikes the same day they occurred instead of finding them in a monthly review. Only after that model was stable did they add a Copilot pilot on top of it.
By contrast, a similarly sized distribution company skipped the model cleanup and rolled out a generative chat tool directly on top of ungoverned spreadsheet exports. Within a month, business teams stopped trusting the tool’s answers, because it confidently reported numbers that didn’t match the finance team’s own figures, and adoption stalled before it started.
The model is the product. Everything downstream, whether it’s a chatbot or a forecast, is only as good as what it’s built on.
How to Choose Where to Start
Use your current data maturity, not the newest headline, to decide which of the three categories to pilot first.
- If your reports are trustworthy but nobody has time to review them line by line, start with augmented analytics.
- If you have a clean, consistent history for one specific metric and a real decision that depends on it, pilot predictive analytics on that one metric.
- If your reports are already reliable and the main friction is getting answers to non-technical stakeholders quickly, generative AI in analytics, including Copilot, is worth testing.
- If none of the above is true yet, the honest first project is data and semantic model cleanup, not an AI layer at all.
AI-powered analytics isn’t a single purchase decision, and treating it like one is what causes most mid-market rollouts to stall. Augmented analytics, predictive analytics, and generative AI in BI solve different problems, need different groundwork, and reward a different kind of patience. The companies getting real value out of tools like Copilot for Power BI aren’t the ones that moved fastest. They’re the ones that sequenced it correctly, starting with the data underneath rather than the interface on top.
Where Addend Analytics Fits
Addend Analytics, a Microsoft analytics consulting partner, works with mid-market companies on exactly this kind of sequencing. Whether that means an early data model audit or a Copilot pilot, the underlying advice stays the same as what’s covered above: fix the foundation before adding a new layer on top of it.
For companies whose reporting still lives across spreadsheets and disconnected systems, that usually starts with governed Power BI dashboards and semantic models. For companies whose data is already in reasonable shape, Addend’s applied AI consulting covers augmented, predictive, and generative AI, depending on which one fits the use case.
Key Takeaways
- Augmented, predictive, and generative AI analytics solve different problems, not one thing.
- Copilot for Power BI now costs about $262 monthly, not $8,000.
- Data quality determines whether AI analytics helps or misleads your team.
- Start with augmented analytics, and save generative AI for trustworthy data.
- Sequence, not speed, determines which mid-market AI rollouts actually succeed.
FAQs
Common questions about augmented analytics, predictive analytics, and generative AI in BI tools like Power BI.
Author By

Rajeshwari Sharma
Rajeshwari is an experienced data professional with a track record of using data-driven insights to improve business performance. She has successfully managed multiple projects, utilising her expertise in data analysis and database administration. As a Microsoft-certified Data Analyst and Azure Database Administrator, she has cultivated a deep understanding of data management best practices and advanced analytics techniques. Her MBA in Business Analytics has equipped her with a solid foundation for integrating business strategy with data insights.