


Drilling down is simply the next level of hierarchical data insights. You might, for example, present a year-by-year sales summary. A Monthly summary, Quarterly summary, or even a day-by-day summary may be of interest to you. As a result, Power BI’s data drill down functionality is critical for highlighting detailed and comprehensive drill down insights.
You might be wondering why this is significant. Because you can view overall sales as 2 M in a yearly revenue chart using drill-down, it’s a very important Power BI feature. There are, however, scenarios in which the majority of revenue is generated in a few months or a single quarter. As a result, digging deeper into the overall picture of summer will provide you with the correct picture.
What is Drill Down and Drill up functionality in Business Intelligence?
Drill down and drill up, in case you didn’t know, make reporting both practical and powerful at the same time. In business intelligence, drill down and drill up are two important features. In data analytics tools, they both give you the freedom to see information and data. Even though they do things differently, this is especially true.
Drill down is a feature that allows a user to go from a broad view of data to a more detailed one with a single mouse click. A report on sales revenue by state, for example, allows the user to select a state, click on it, and view sales revenue by city or county in that state.
Drill down is a feature that allows you to go much deeper into more specific data or information layers being assessed, and it’s what we call “drill down.”
Remember that drilling down is a technique for quickly navigating through worksheet data and finding answers to the questions that your company is facing. You can use the drilling to detail method to look up the values that make up a particular summary value. You can also drill down to related items, adding data that isn’t currently included in the worksheet.
Advantages of drill down and drill up function in data exploration
When it comes to data discovery, the drill down and drill up functions have numerous advantages.
The following are a few of these advantages:
It reduces the amount of reporting required and improves overall reporting performance
The drill down function can lighten the overall load on the server during the query period by presenting only one layer of data. As a result, it improves reporting performance while also providing excellent value to end users.
Examine data from various angles
Drill up allows users to evaluate the same data across multiple reports, using various features, and even highlighting it using various visualisation processes. This vastly improves different users’ understanding of the data and the reasons behind the numbers.
Get instant access to a variety of data depths
Drilling down gives users a much better understanding of the data by allowing them to see what makes up the numbers they’re looking at. For example, drill down answers to questions like Which states are doing better on my national sales figure in a matter of seconds. Which states are currently lagging behind? Which states’ territories generate the most revenue?
Drill Down Vs. Drill Up Vs. Drill Through the process in Power BI
Are you a beginner when it comes to Business Intelligence (BI)? Then there are new concepts and vocabulary to learn, which could be the most difficult learning obstacles you’ll face. That is, until you come across a database that resembles a garbage can rather than a well-organized library.
What does drilling have to do with reporting and dashboards? Drill up, drill down, drill through—what does drilling have to do with reporting and dashboards? Was the person who came up with these terms related to a woodpecker?
Here’s a quick overview of the major differences between these three:
Drill Down
The best way to learn how to use the drill down function is to pretend you’re going through the hierarchy levels. It is required by definition to use a hierarchical definition in which values are classified into levels.
Here are great examples of levels:
- Do you have any data that is based on a specific date? Then the level of groupings could look something like this: Year, Month, Year’s Day, Quarter, and Hour
- Do you have any geographic information? The level might then look like this: Country, Province/State, Postal Code, and City are all required fields.
Drill Up
Drilling up is the polar opposite of drilling down, to put it simply. It can be used as a data exploration entry point for information that is constantly changing.
Do you have data on a daily basis? To see the most recent results, it makes sense to default the dataset to show the bottom level. Drilling down becomes a system that allows the user to easily see new results while exploring more trends.
Drill Through
Meanwhile, drilling through is simply another word for navigation. It is, however, a crucial principle because it allows users to click on a visualisation to explore more related information. In other words, you’re taking the user’s clicks and redirecting them to a different dashboard or report that displays related data.
Drill down and drill up reports in Microsoft Power BI
Users can pilot a different layer of data by steering and clicking a specific data element in an application or data element in a drill down BI report. Drilling down allows users to discover multidimensional data by navigating from one level to the next.
Users can also see aggregated, summary data and then navigate hierarchically to find deeper data levels for a more detailed analysis. Drilling down is also a key feature of OLAP, allowing users to address complex multidimensional data issues.
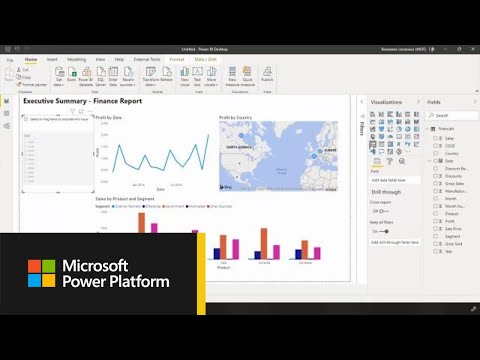
Getting Started with the Power BI Desktop
How to setup drill through functions in Power BI (Setting up the hierarchy, drill pathways, and accessing drill features)
Drill is a type of indicator in Power BI that allows you to focus on a specific type of data or value displayed or generated in a report. It’s extremely useful when a business user needs to focus on only a few specific elements rather than a large amount of data.
Drill through is a feature in Power BI that allows you to navigate through different layers of data in a selected category data set.
Go to the report you’ve already published to the Power BI Service or open your Power BI Desktop file. Then you can go to the page you want to use as the drill-through action’s target. When you start editing the report page, you’ll notice a Drill through Filters section in the right corner.
After adding the field to the Drill through Filters section, a small back arrow will be added to the report. This will allow you to quickly return to the report page where the drill-through action was initiated.
That is all there is to it. You can now use the drill through action on any other page of the report with ease. Drill through action can be triggered by right-clicking a chart that uses the field you added to the Drill through Filters section. Drill through the options and select your report.
For example, in the bar chart, you selected the Life Skills bar and chose your Drill through action. This will bring you to the Subject Dashboard, which is the target of your drill through action, with the appropriate filter applied.
Drill down all fields at once and Drill down one field at a time
In your visualisations, there are two ways to drill down. Both of these methods produce the same results. You can use whichever method you prefer.
The first method makes use of the drill icons that appear in the visualization’s top sections. Drill down is enabled by selecting the arrow icon in the top right corner of the visualisation. The drill is turned on when the icon turns dark.
What’s the best way to drill down one field at a time? In a bar chart, you can choose one of the visualization’s elements. As you drill down and back up, you’ll notice that the title changes. To drill up, select the icon in the upper right corner of the visualisation.
How can I drill down into all fields at the same time? Select the double arrow on the top left side of your visualization to do so.
The Data/Drill tab from Power BI’s top menu bars is used in the second method.
Drill down is activated by selecting a visualisation from the top menu bars and making it active. The icon in the top right section changes to a black background when you click Data/Drill > Drill Down.
To drill down all fields at once, go to Data/Drill > Show Next Level. Drill/Data > Drill Up to return to the previous level of drilling.
Conclusion:
To summarise, drilling down allows you to discover multidimensional data by navigating from one level to the next. Take note that drill-down is available in the user interface, allowing users to reveal their fine levels by clicking on the data representation. Drill-down reporting also allows you to delve deeper into reports for analytical purposes.
Conclusion:
Despite its flaws, the Power BI Report Server is one of the best on-premises analytics software infrastructures for creating custom charts and layouts for users. Additionally, the user organisation has access to certain tools such as Power BI Reports, Mobile Reports, and others that come with it.
Finally, each company or organization must determine whether or not this app supports its enterprise reporting needs.
