
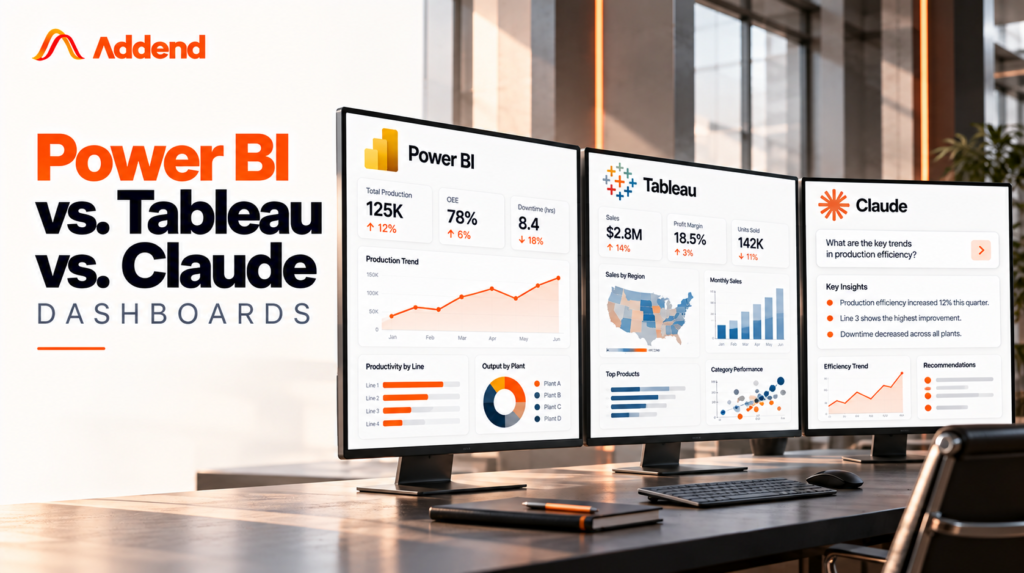
TL;DR Power BI is the strongest choice for governed, company-wide reporting, especially in Microsoft environments. Tableau is the better fit for visual exploration and Salesforce-centred teams. A Claude dashboard is...
Read More »Why Accelerators Beat Big Transformations for Analytics and AI
For years, analytics and AI progress have been framed as a transformation problem. Large roadmaps. Multi-year programs. Enterprise-wide redesigns. Centralized platforms meant to “solve analytics once and for all.” On
Afroz Labbai
Monday, August 31, 2026
From Dashboards to Decision Automation: The Real Analytics Maturity Model
Most leadership teams today don’t suffer from a lack of data. They suffer from hesitation. Dashboards are everywhere. Reports are refreshed daily. KPIs are reviewed weekly. Yet when decisions need
Gaurav Lakhotia
Sunday, August 30, 2026
Power BI in Retail Digital Transformation: Boost Sales & Loyalty
The retail industry worldwide is experiencing a massive transformation. According to McKinsey, retailers that adopt advanced analytics and business intelligence tools can improve operating margins by up to 60%. Meanwhile,
Gaurav Lakhotia
Saturday, August 29, 2026
Microsoft Fabric Consulting: Pricing, Copilot, and Power BI Compared
TL;DR Microsoft Fabric consulting helps businesses unify scattered data tools, engineering, science, real-time analytics, and reporting, into one connected platform instead of juggling separate systems. The right consulting partner also
Kamal Sharma
Saturday, August 29, 2026
From Gut Feeling to Data-Driven Decisions: What Actually Changes
Almost every leader today says they want to be data-driven. But if we look closely at how decisions are actually made inside organizations, a different story often emerges. Most decisions are still driven by: Data,
Afroz Labbai
Saturday, August 29, 2026
Exporting Multiple Tables to Excel Tabs in SSRS
Exporting Multiple Tables to Excel Tabs in SSRS Introduction In enterprise reporting, exporting data to Excel is one of the most commonly used features. Business users often require reports where multiple datasets or table
Kamal Sharma
Saturday, August 29, 2026