Being a data analyst, one is often given a web scraped messy data. So before analysing anything analysts dig deep into data to scrupulously pinpoint the mistakes and perform many types of sanity checks to ensure that the data is reliable.
Data cleaning and preparation is the toughest task in data analytics. Data cleaning demands thoroughly going through the data points to comprehend what data quandary exists. Once the data problems are determined, they can be resolved as required.
In this article, I will demonstrate how data cleaning can be performed using python and pandas.
You can refer the code used in this blog at Addend-Analytics/Data-Cleaning-in-Python: Demonstrate how to clean data using python and pandas (github.com)
Dataset
For this article, I have taken a sample dataset that contains the details of used cars which are being sold again.
So, the first and foremost thing is to import the dataset.
# import required packages
import pandas as pd
import re
import numpy as np
# importing dataset
df = pd.read_csv(‘USA_cars_datasets.csv’)
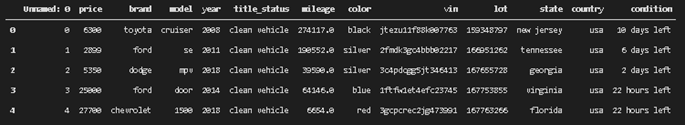
df.head()
Here’s what the data looks like:
Now, to get an overview of the dataset, simply call the function df.info(). This will produce the following output.
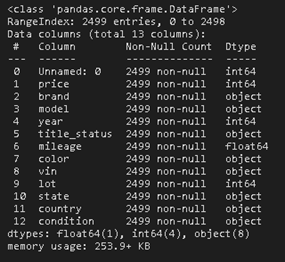
The output generated gives us a basic overview of the data.
Dropping unrequired columns
From the above output, it can be confirmed that there are no missing values in the dataset. However, there is a column Unnamed:0 that is not required, so it can be dropped.’
df = df.drop(columns=[‘Unnamed: 0’])
Replacing Wrong values
Upon inspecting the data, I found that the color column has some wrong values. So, these values can be replaced with no_color since the values with no color are already filled with these.
df[‘color’] = df[‘color’].replace(‘color:’, ‘no_color’)
Normalizing Columns
Now in the condition column the number of time left is mentioned in days as well as hours. It does not follow a uniform structure, so it is not appropriate format for comparing. It is advisable that data points should in same format if they are being compared.
To solve this problem two new columns can be created – one stores the time and the other stores the day/hours. This can be extracted from the condition.
# extract number
df[‘days/hours’] = df[‘condition’].str.extract(r'(\d+)’)
# extracting days or hours from the “days”
# duplicating condition column
df[‘days’] = df[‘condition’]
# remove “left” from “days” column
df[‘days’] = df[‘days’].str.replace(‘left’,”)
# replace number from “days” column
df[‘days’] = df[‘days’].str.replace(r'(\d+)’,”)
If days contains days, then the hours value should be multiplied by 24, otherwise there is not need for any change as it is already mentioned in hours. # converting number of days
# converting number of days to humber of hours
df[‘hours’] = df.apply(lambda x: int(x[‘days/hours’]) * 24 if x[‘days’] == ‘ days ‘ else x[‘days/hours’], axis=1)
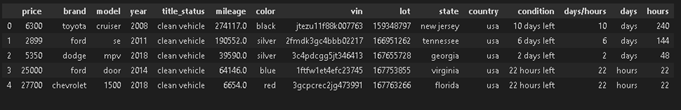
The final dataset looks something as below:
Conclusion
Now the data is cleaned and normalized. This data further can be used for analysis by data analysts.