In the world of Business Intelligence, fact tables play a crucial role in data modeling, acting as a central hub for important metrics. Let’s explore different types of fact tables, connecting the dots between sales insights and data modeling essentials.
1. Header/Line Fact Table: Boosting Sales Analysis
In sales, the Header/Line Fact Table is a key player. Imagine buying multiple items online, like on an e-commerce website. The Line Fact Table tracks the price of each item, and the Header Fact Table adds it up to show the total order price. This setup helps analyze sales comprehensively, revealing the details of each purchase.
2. Allocated Facts: Navigating Distribution Challenges
Allocated Fact Tables handle distribution complexities. Think about buying from a platform with multiple sellers, like an e-commerce website. Shipping charges vary based on distance and urgency, making cost allocation tricky. Allocated Fact Tables step in, ensuring fair distribution of costs to each product. Precision in allocation is crucial for a balanced perspective.
3. Year to Date (YTD) Facts: Capturing Overall Business Performance
Moving from sales intricacies, Year to Date (YTD) Facts shine in measuring cumulative business performance. Designed to capture cumulative values from the year’s start to the present, this dedicated fact table provides a holistic view. Consider calculating a company’s first-quarter revenue-YTD Facts seamlessly compute cumulative revenue, offering a comprehensive understanding.
Exploring Different Types of Fact Tables
In the vast world of data modeling, fact tables are like the architects that structure information. Let’s delve into various types of fact tables, each with its unique characteristics and role in shaping how we understand data.
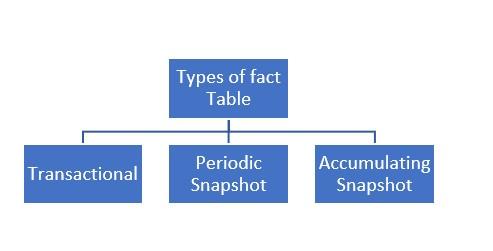
1. Transactional Fact Table
This is the bedrock, containing data of fixed events. Think of it as the detailed diary of your business operations. It holds atomic data, which means it doesn’t aggregate or summarize information. At the lowest granularity, it captures every nitty-gritty detail, making it substantial in size-often housing millions of records.
2. Periodic Snapshot Fact Table
Derived from the Transactional Fact Table, the Periodic Snapshot Fact Table takes a step back to offer a more aggregated perspective. It’s like a summarized version of your detailed diary. For example, if the Transactional Fact Table stores daily data, this table presents it in a more digestible form-weekly or monthly. Each row offers insights for a specific snapshot period, providing a broader view.
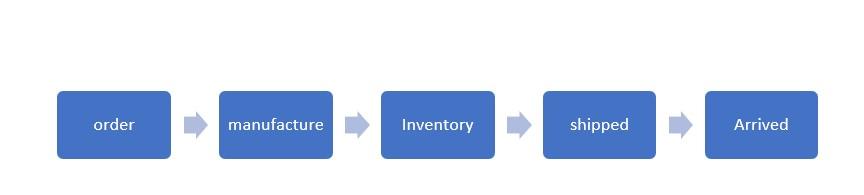
3. Accumulating Snapshot Fact Table
Imagine a story unfolding step by step, where each event depends on the previous one. The Accumulating Snapshot Fact Table is like a storyboard capturing these evolving events in your business processes. It’s designed to measure the time spent on each step, offering a dynamic understanding. As the process status changes multiple times, this table sees frequent updates, making it an ideal tool to measure and optimize entire business processes.