
In this blog, we will be appending two different queries using PowerBI. This feature is very useful if you want to combine two data tables. We can also append more than 2 tables using PowerBI.
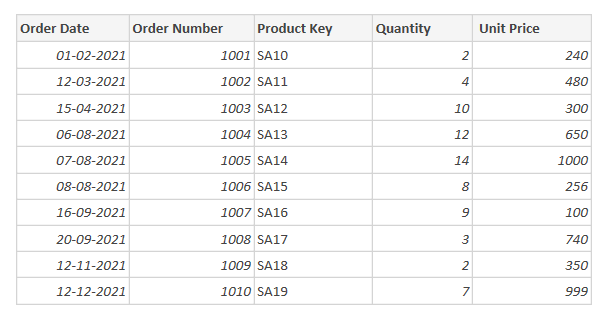
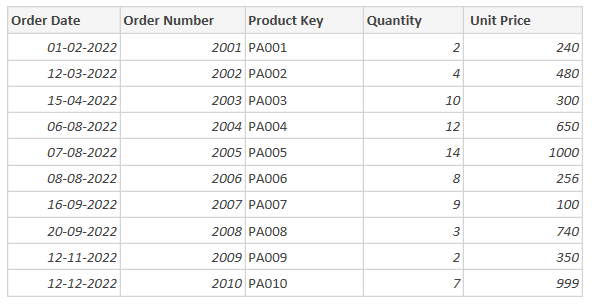
In the above screenshot, we have sales data for the years 2021 and 2022.
Now, we’ll combine the above 2 data tables. Below are the steps to append them:
Step 01:
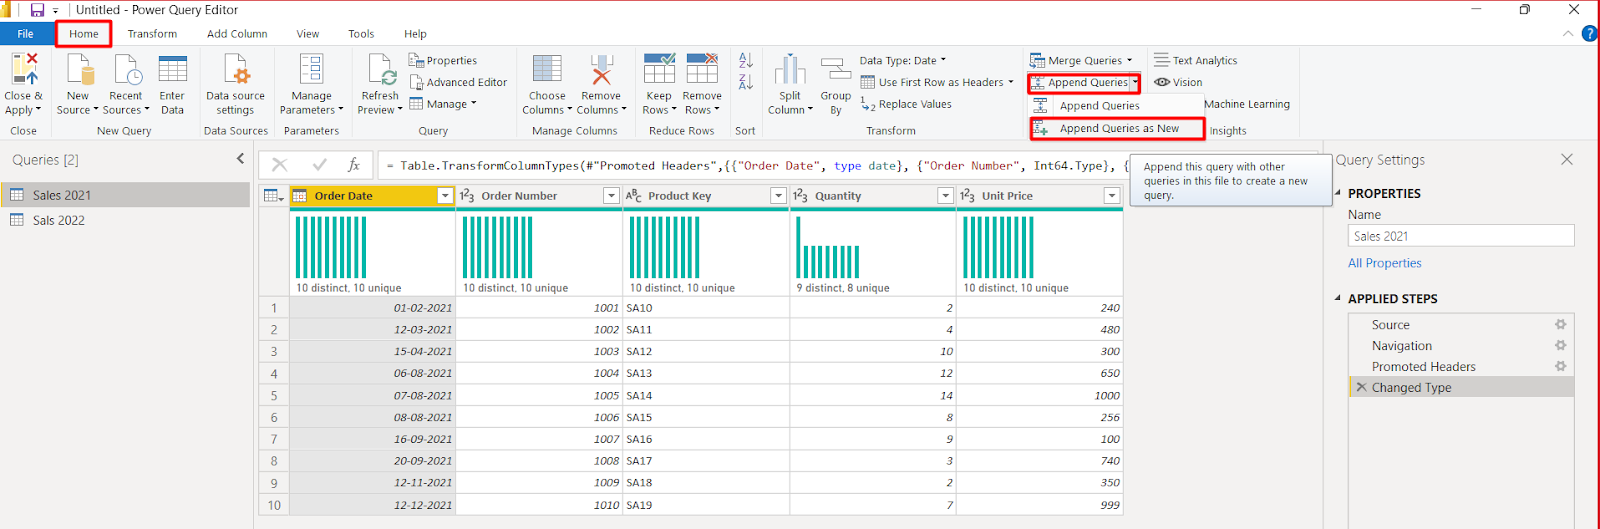
Select Home > Transform Data.

Step 02:
Then go to Home Ribbon. Click on Append Queries Drop-down. You’ll get two options.
- Append Queries
- Append Queries as New
Step 03:
When we will click Append Queries as New a new window will appear as shown below.
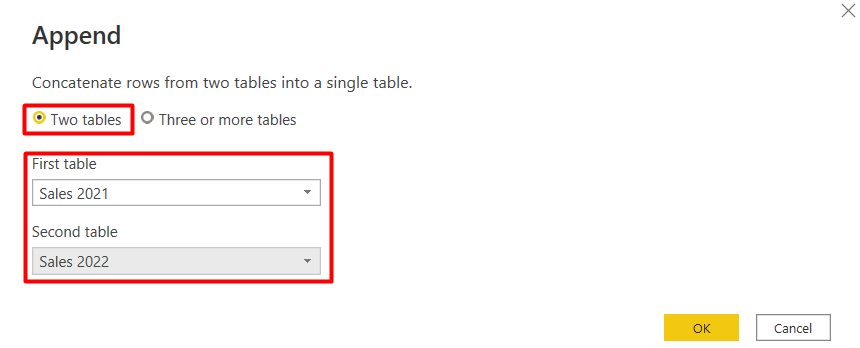
Select the Two tables option as we are Appending 2 tables. If you want to append more than 2 tables, you can select the other option (Three or more tables).
And below you will get the option to select the table. After selecting both tables click OK to append both tables (Sales 2021 and Sales 2022).
Step 04:
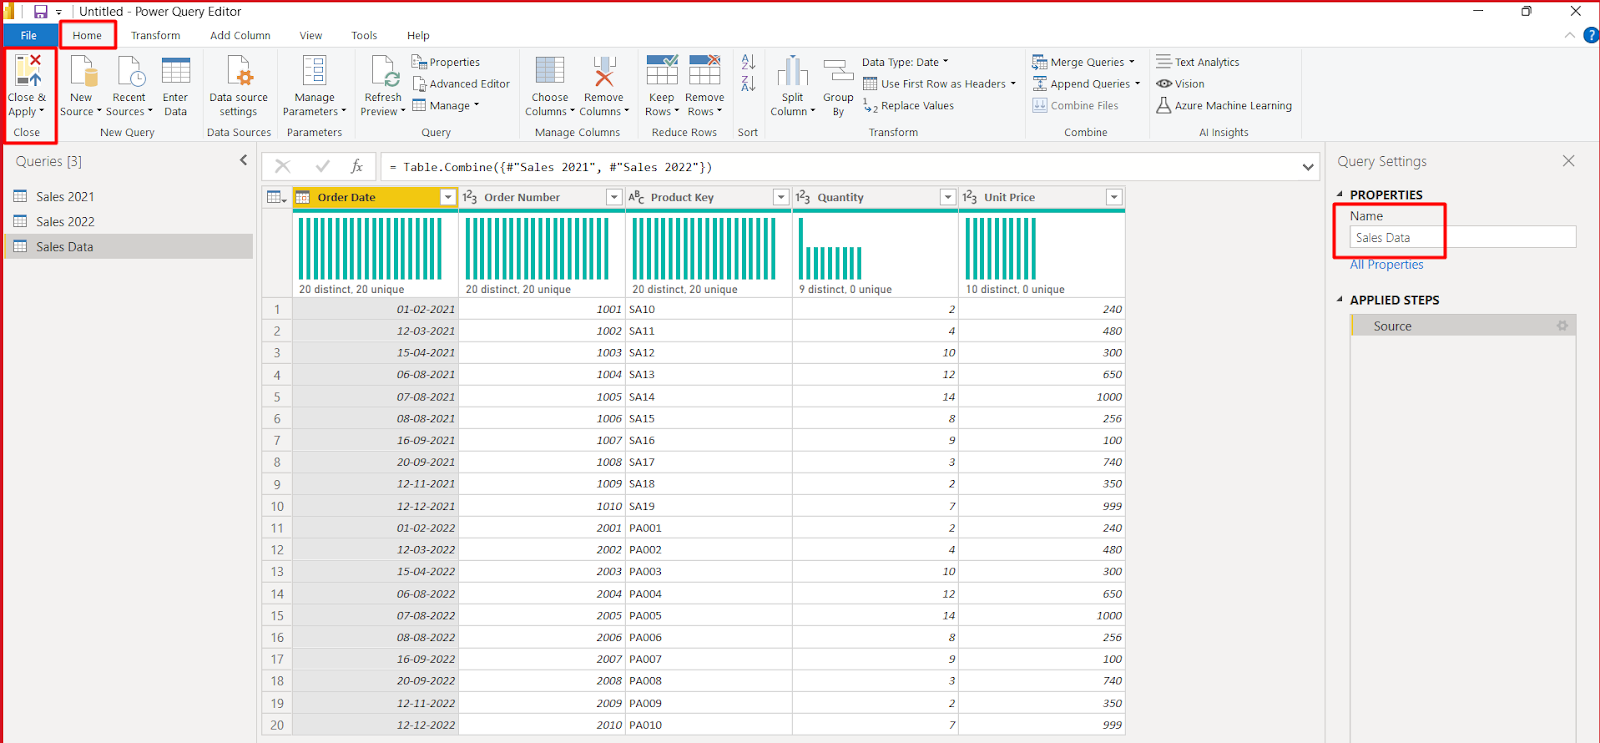
After clicking OK your tables will be appended as a New Table. You can rename the table (Sales Data). And click the Close and Apply button present in the ‘Home’ tab Ribbon to save all the changes.
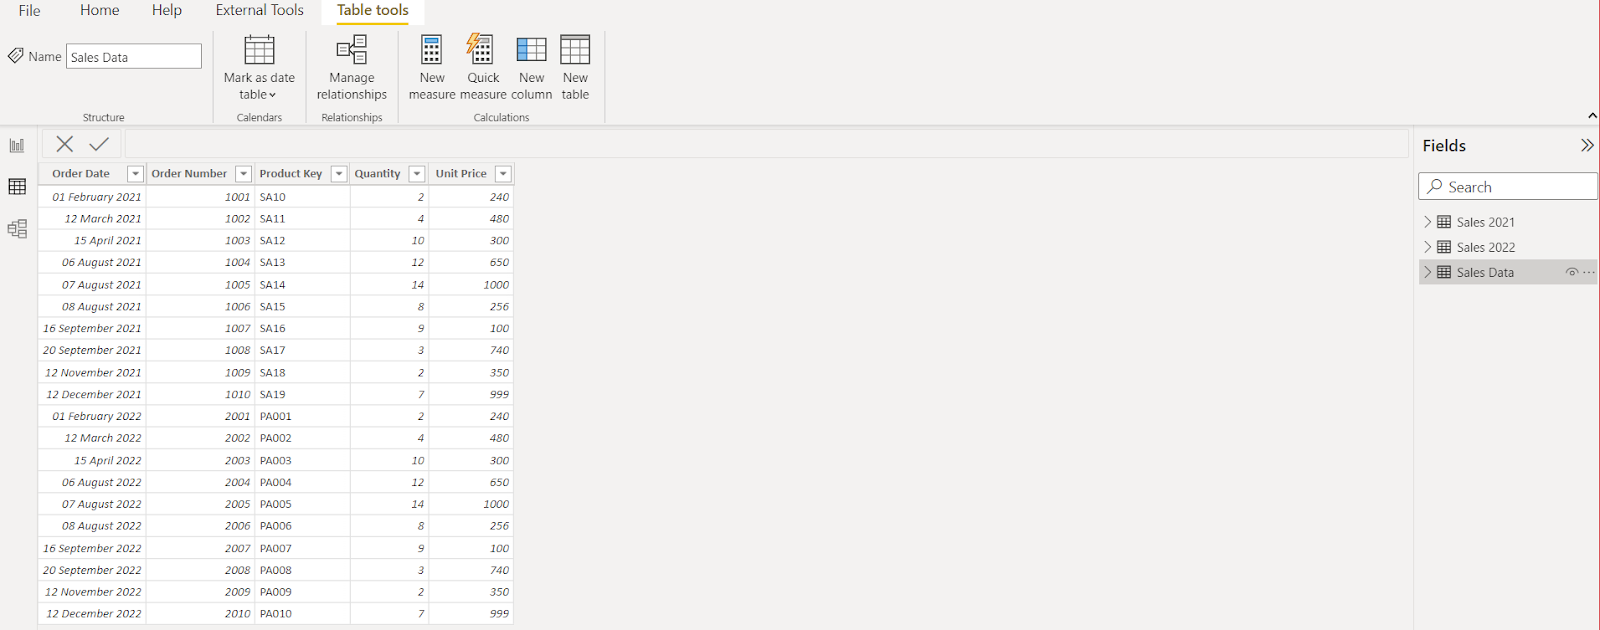
In the below screenshot, you will be able to see the new appended table as Sales Data.
So, in this blog, we have learned how to append queries.
Thanks
Author By

Kamal Sharma
Kamal brings over 20 years of experience in data analytics and business intelligence. He has led the design and implementation of analytics solutions across operations, financial reporting, and performance improvement initiatives. With a background in business statistics and Six Sigma, his work focuses on applying data in a structured and practical way to solve real business challenges.