You have access to a wealth of metrics as a retailer with a top-notch retail management system. With so much data at your fingertips, it’s easy to become overwhelmed, so Key Performance Indicators (KPIs) can help you figure out which metrics to utilise to keep your company moving in the right path. KPIs are helpful in making proactive business decisions and give you with insight into critical aspects of your business when they are frequently reviewed.
Because every retail operation is different, some of the metrics presented in this blog may not be applicable to yours. In any case, these are the KPIs that we believe are critical for any business. We have included the calculation methods for your convenience, so you can quickly and simply start using these data into your business.
#1 Gross Margin Return on Investment (GMROI)
Because it provides the finest overall picture of your store’s success, GMROI may be the most critical KPI to track in your retail operation. Simply said, GMROI is a metric that assesses your profit return on inventory investment. This provides a solution to the vexing issue, “How much do I make every dollar invested in inventory?” This indicator is important to track since it allows you to see how your business is doing in general and how you can improve inventory, price, and merchandising on individual products.
Calculation: Gross margin / average inventory cost = profit return
#2 Sales per Square Foot
First and foremost, businesses should monitor sales per square foot, which is essentially the average revenue per square foot of sales area in the shop. This is an important KPI to evaluate because it allows you to determine how efficient your sales space is. It specifically aids in determining which regions of your store are more successful, as well as aligning your sales and marketing activities depending on income per location. Analyze this metric the next time you’re deciding on a store layout and improve how you place your products.
Calculation: Total sales / total square feet of sales space = sales per square foot
#3 Inventory Turnover
Inventory turnover, also known as stock turn, simply refers to the number of times inventory or stock is sold over a given period of time; however, most merchants keep track of this metric on an annual basis. This KPI is critical to track since it gives you insight into how much merchandise you’re selling and helps you to examine your inventory levels to see if they’re too large or small. As a result, overall efficiency improves as inventory costs decrease and earnings rise.
Calculation: Cost of goods sold / average inventory = inventory turnover (per defined time period)
#4 Average Purchase Value
You want to know how much each consumer spends on average in your store as a retailer. You can rapidly estimate the average dollar amount per transaction in a certain time period, such as daily, monthly, quarterly, or yearly, by analysing your average buy value. This is an important metric since it can help you improve your pricing and sales methods, such as combining things and raising prices on low-value items.
Calculation: Total revenue (for a given time period) / number of transactions = average purchase value
#5 Total Sales Count
The sales count is an important but simple metric. It calculates the total number of transactions handled in your shop over a set period of time. This is crucial to measure since it allows you to see how much merchandise you sell and how active your store is during the day, week, month, and year. As a result, you’ll be able to better coordinate personnel schedules, marketing initiatives, customer service, and so on. For example, if you’re usually busy from 12 to 3 p.m. on Saturdays, you’ll know to hire more people at that period. Similarly, if Monday mornings are your slowest hours, you know you don’t need as many people in your store as you do on Saturdays.
Calculation: Total number of sales in a defined time period
#6 Product Returns
Product returns should be tracked by all retailers to identify any issues with product quality, customer service, or sales or marketing promises. For instance, one of your salespeople may have promised that your product would do something that it didn’t. You can analyse areas where your retail firm may be falling short by reviewing the nature of all product returns. In a nutshell, product returns refer to the percentage of products that are returned in a specific period of time.
Calculation: (Number of returns / number of items sold) x 100 = product return percentage
#7 Sell-Through Percentage
Another KPI is the sell-through percentage, which simply refers to the percentage of products sold vs the total number of items offered for purchase. As a retailer, this is vital to track because it informs you about how your products are performing, allowing you to make better judgments about sale items and re-order numbers.
Calculation: (Number of items sold / beginning inventory quantity) x 100 = sell-through percentage
#8 Profit Margin
Profit margin is an obvious metric, but we can’t overlook the importance of knowing how much money you are actually earning after deducting the costs of goods sold. Additionally, it allows you to determine if your sales are costing you more than you’re making. That way, you know exactly how to adjust your overall operational costs and prices of items.
Calculation: (Gross profit / total revenue) x 100 = profit margin percentage
These are just a few KPIs you may monitor in your ERP system to see how your retail business is doing in terms of inventory, sales, and marketing. Because each retail operation is unique, you may need to tailor your KPIs and ERP dashboard to represent the aspects of your business that you want to examine.
We believe the measures listed above are critical to improving your overall efficiency, and we hope you found this post useful. Check back with Addend’s retail blogs for more information on retail KPIs and dashboards, as well as how an end-to-end retail management system can help you develop your business while lowering operational expenses.
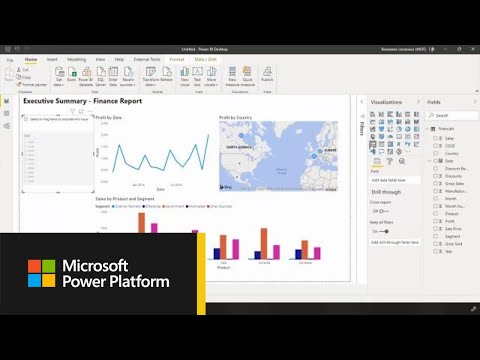
Getting Started with the Power BI Desktop